

Three property website image layout patterns dominate agent sites: the full-bleed hero, the grid mosaic, and the narrative scroll. Each handles photos differently, and each buries or surfaces conversion opportunities in predictable ways. The layout you choose controls where a visitor’s eyes land and whether they ever reach your contact form.
TL;DR: Full-bleed heroes generate emotional impact but push CTAs below the fold. Grid mosaics show listing volume but scatter attention across dozens of thumbnails. Narrative scrolls embed conversion points between images but slow browsing speed. A proper website design audit for agents should start with which gallery pattern matches your traffic source, because real estate visual hierarchy conversion depends on layout structure before it depends on photo quality.
Why Property Gallery Optimization Starts with Scanning Patterns
Users form a design opinion in roughly 50 milliseconds, according to research cited across UX studies in 2025 and 2026. That snap judgment determines whether they scroll or bounce. And Google’s algorithms now evaluate dwell time, bounce rate, and return visits as engagement signals that influence rankings, so a gallery layout that repels visitors punishes both your conversion rate and your search visibility.
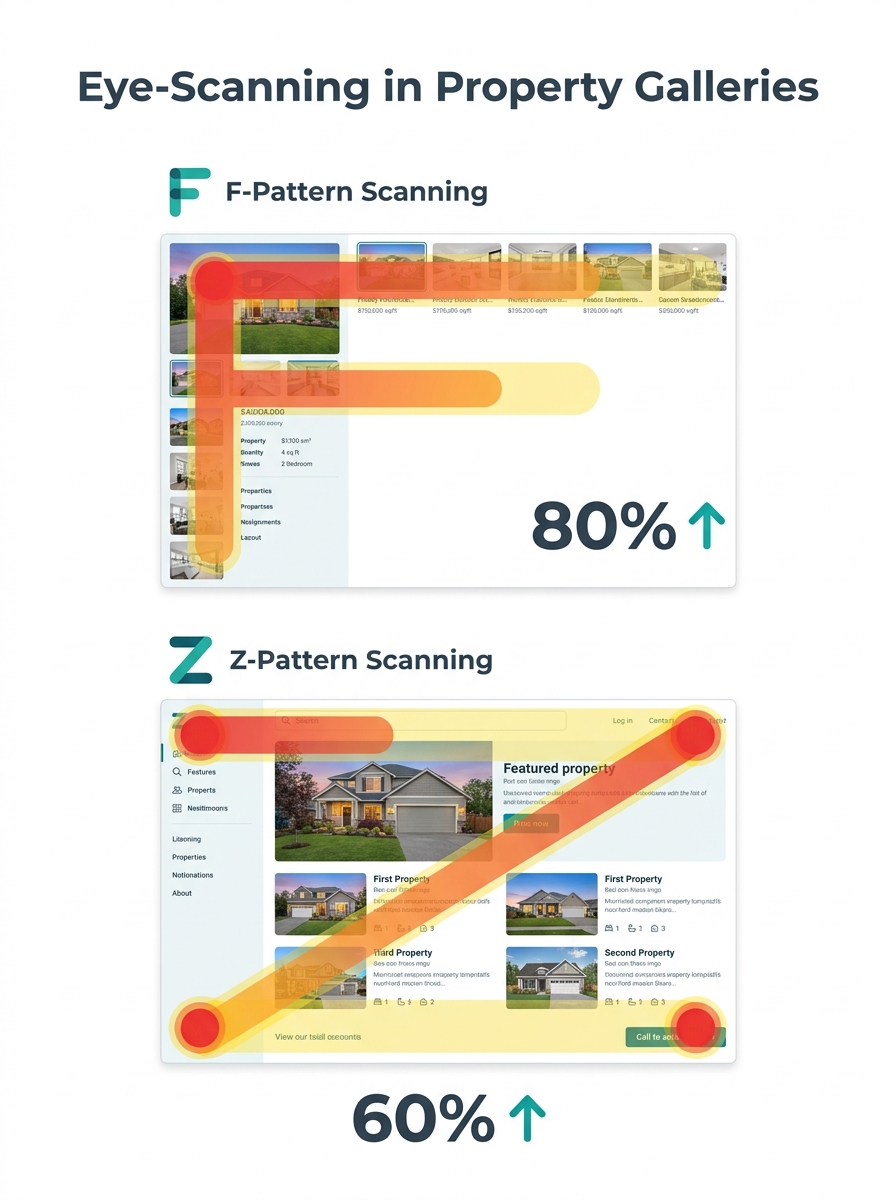
On text-heavy pages, visitors scan in an F-pattern, reading across the top, dropping down the left side, then scanning across again. On minimal, image-driven layouts like listing landing pages, they shift to a Z-pattern, moving diagonally from top-left to bottom-right. A UX analysis from Eleken puts it plainly: “Use spacing strategically, tighten spacing within groups and increase spacing between unrelated sections to clarify relationships.” If your gallery fights the natural scanning direction, your CTA sits in a dead zone regardless of its color or size.
The rule of thirds reinforces this. Visme’s breakdown of visual hierarchy principles describes the method: “mentally dividing a composition into a grid composed of two horizontal and two vertical lines, or nine separate sections,” then placing key elements at the intersections. Real estate galleries rarely follow this. They dump 15 to 30 photos into a container and call it done.
An analysis from UPRealer covering 126 real estate companies, each with 50,000 or more monthly visitors, found that average conversion rates in real estate rank well below other industries. That data point matters here because the gallery page is often the highest-traffic page on a listing site, and the lowest-converting. Agents who think the problem is photo quality are solving the wrong equation. The problem is usually the container those photos sit in.
Full-Bleed Hero Galleries Prioritize Emotion Over Information
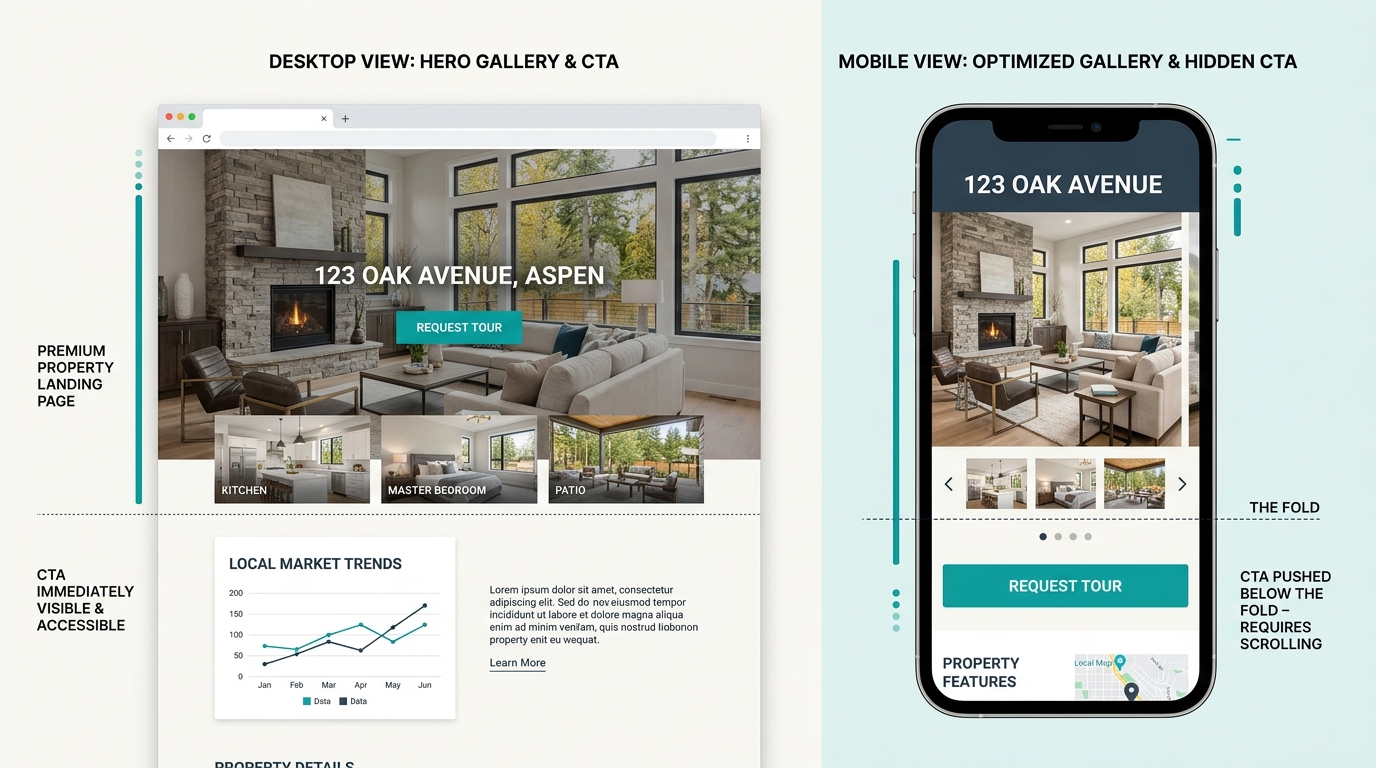
The full-bleed hero approach fills the viewport with a single large image, often a wide exterior or a dramatic kitchen shot, paired with a small set of navigation arrows or dots to flip through remaining photos. Agents love this layout because it looks cinematic. And professional photography in this format does create emotional connections that drive faster buyer decisions. The research from WiserNotify confirms that clear, large property visuals help buyers “move forward in the process.”
But the tradeoffs are steep. A full-bleed hero pushes every CTA, every contact form, every call-to-action button below the fold. On mobile, where most property searches happen, a single hero image can consume the entire screen. That means a buyer who lands on your listing sees one beautiful photo, swipes through five or six more, and never scrolls down to the “Schedule a Showing” button. Research suggests proper visual hierarchy can lift conversions by 30% or more. Full-bleed heroes forfeit that lift by treating the gallery as a standalone experience separated from conversion elements.
This layout works best when: your traffic comes from social media ads where emotional first impressions drive engagement, you’re marketing luxury listings above $1M where buyers expect editorial-quality presentation, or you’ve placed a persistent sticky CTA that follows the user as they scroll. Without that sticky element, the full-bleed hero is essentially a slideshow that leads nowhere.
If your CTA button placement analysis shows clicks concentrated above the fold, the full-bleed hero is actively working against you.
Grid Mosaics Show Volume but Fragment Attention
The grid mosaic displays 8 to 24 thumbnails in a tiled arrangement, sometimes with one larger feature image anchoring the top-left corner. This is the default layout on most MLS-connected agent sites and many IDX-integrated platforms. It gives buyers a quick visual overview of the property and lets them click into any room that interests them.
The conversion problem with grids is attention fragmentation. When a visitor sees 16 equally-sized thumbnails, no single image commands priority. The eye bounces between the kitchen, the backyard, the master bath, and the front porch without settling. A 2026 redesign case documented a 28% jump in click-through rates after moving a promotional CTA from the page footer to a high-contrast position above the fold. Grid mosaics typically bury that high-contrast CTA opportunity beneath rows of equally weighted images.
When every image is the same size, no image matters. Grid galleries treat visual democracy as a feature, but conversion requires directing attention, not distributing it.
White space is the other casualty. DMR Media’s 2026 website audit checklist calls a regular site audit “one of the highest-ROI activities a top agent can perform,” and spacing problems rank among the most common findings. Strategic white space improves text readability by up to 20%, according to UX research. Grid mosaics squeeze that space out, packing thumbnails edge to edge and leaving no breathing room for CTA buttons, agent contact info, or pricing callouts.
Grid mosaics work best when: your visitors arrive with high intent and want to scan the full property quickly (direct MLS referral traffic, email campaign clicks), you pair the grid with a fixed sidebar containing your contact form, or you limit the grid to 6 to 8 images and use the remaining space for conversion elements. Above 12 thumbnails, engagement data consistently shows diminishing returns per additional image.
Tip: Run a quick test on your grid gallery: blur your screen or squint at the page. If no single element stands out clearly, your visual hierarchy is flat and your CTA is invisible. UX designers call this the “squint test,” and most agent grid galleries fail it immediately.
Narrative Scrolls Trade Browsing Speed for Conversion Density
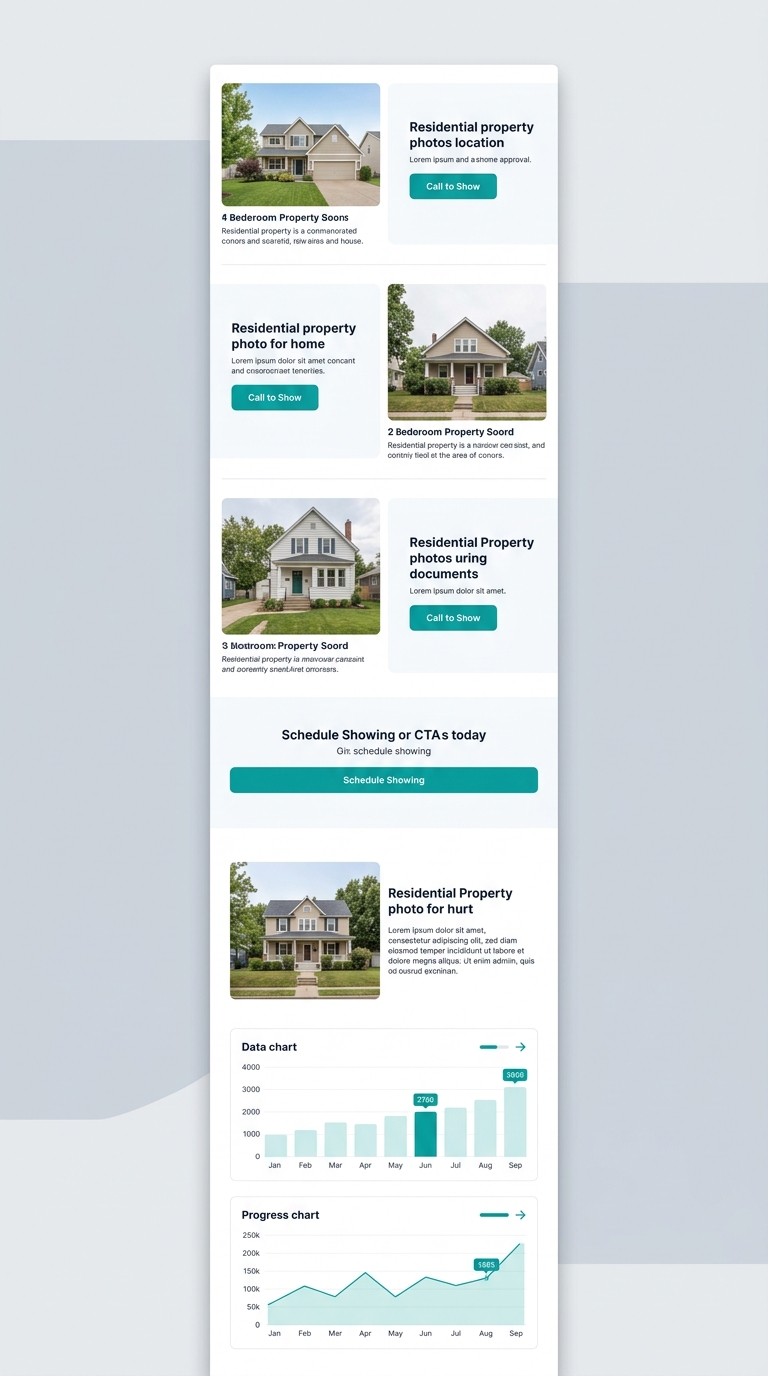
The narrative scroll treats a listing page like a vertical story. One image fills the screen, followed by a paragraph of context (“the chef’s kitchen features quartz countertops and a 48-inch range”), then another image, then a CTA block (“Schedule a private showing”), then another image. The visitor scrolls through the property the way they’d walk through a physical showing.
This layout directly addresses the conversion burial problem because CTAs appear between images rather than after them. Ignite Visibility’s guidance on image optimization recommends ensuring “images are compressed and no larger than necessary, in the right file formats (JPEG for photos, PNG for graphics with fewer than 16 colors).” With narrative scrolls, this advice is doubly important because each image loads sequentially as the user scrolls, and any uncompressed photo creates a visible stall in the experience.
The tradeoff: speed. Buyers browsing 8 to 12 listings per session don’t want to scroll through a curated story for each one. They want to see the kitchen, check the backyard, glance at the bathrooms, and move on. The narrative scroll forces a linear path through content that many buyers would prefer to browse non-linearly. And if your website performance scores are already slow, adding sequential full-width images with interleaved text blocks will tank your Core Web Vitals further.
Narrative scrolls work best when: you’re marketing a featured listing with its own dedicated landing page, the property has a compelling story (historic home, major renovation, unique architecture), or your audience skews toward sellers evaluating your marketing approach. Seller prospects who see a narrative scroll think, “This is how my listing will be presented.” That perception converts at a different rate than buyer-focused gallery browsing.
How the Three Layouts Compare Across Key Metrics
| Metric | Full-Bleed Hero | Grid Mosaic | Narrative Scroll |
|---|---|---|---|
| First impression impact | High (cinematic, emotional) | Medium (informational overview) | Medium-high (storytelling) |
| CTA visibility above fold | Low (pushed below) | Low-medium (compressed into grid) | High (embedded between images) |
| Browsing speed | Moderate (arrow-click navigation) | Fast (full overview at once) | Slow (linear scroll required) |
| Mobile performance | Poor without sticky CTA | Moderate (small thumbnails) | Good if images compressed |
| Best traffic source | Social media ads, luxury | MLS referrals, email campaigns | Dedicated landing pages, seller prospects |
| Conversion fix difficulty | Medium (add sticky CTA) | High (requires layout restructure) | Low (CTAs already placed inline) |
| Image count sweet spot | 5-8 hero images | 6-12 thumbnails | 8-15 with text blocks |
How To Choose Between These Three
The right property website image layout depends on two variables: where your traffic originates and whether you’re optimizing for buyer leads or seller leads. Agents running Facebook or Instagram ad campaigns to luxury listings should start with the full-bleed hero, add a sticky contact button, and ensure it stays visible on mobile viewports. Agents whose traffic comes primarily through IDX search results and MLS referrals will convert better with a condensed 6-to-8-image grid paired with a fixed sidebar form. And agents using dedicated property landing pages for featured listings, or trying to win seller presentations, should build narrative scrolls that demonstrate marketing quality while embedding CTAs every 3 to 4 images.
Carrot’s analysis of real estate investor websites challenges the industry’s 2-3% conversion rate benchmark, arguing that properly optimized pages perform far above that number. The gallery layout is one of the highest-impact elements to test because it controls attention flow across the page’s most-viewed section.
Run a real estate visual hierarchy conversion audit on your own site this week. Open your top 3 listing pages, apply the squint test, and check whether any CTA is visible without scrolling past the gallery. If you’ve been tracking which website features actually generate leads versus which drain budget, you already know that the prettiest gallery means nothing if it sends every visitor into a photo browsing loop with no exit toward a contact form. Pick the layout that matches your traffic, compress your images to proper formats, and put a conversion element where the eye naturally lands. The gallery should sell the showing, not replace it.