

Google’s March 2026 core update lowered the “good” Largest Contentful Paint threshold from 2.5 seconds to 2.0 seconds, and agent sites that still load above the old cutoff have dropped 2 to 4 ranking positions on competitive local queries. That ranking slide translates into fewer listing views, fewer form fills, and a compounding lead deficit that grows every week the site stays slow.
TL;DR: Three Core Web Vitals — LCP, CLS, and INP — drain leads from real estate websites through different mechanisms. LCP kills first impressions and rankings. CLS erodes trust during browsing. INP blocks interactions that convert visitors. The order you fix them determines how fast you recover lost conversions, and 47% of websites currently fail the assessment entirely.
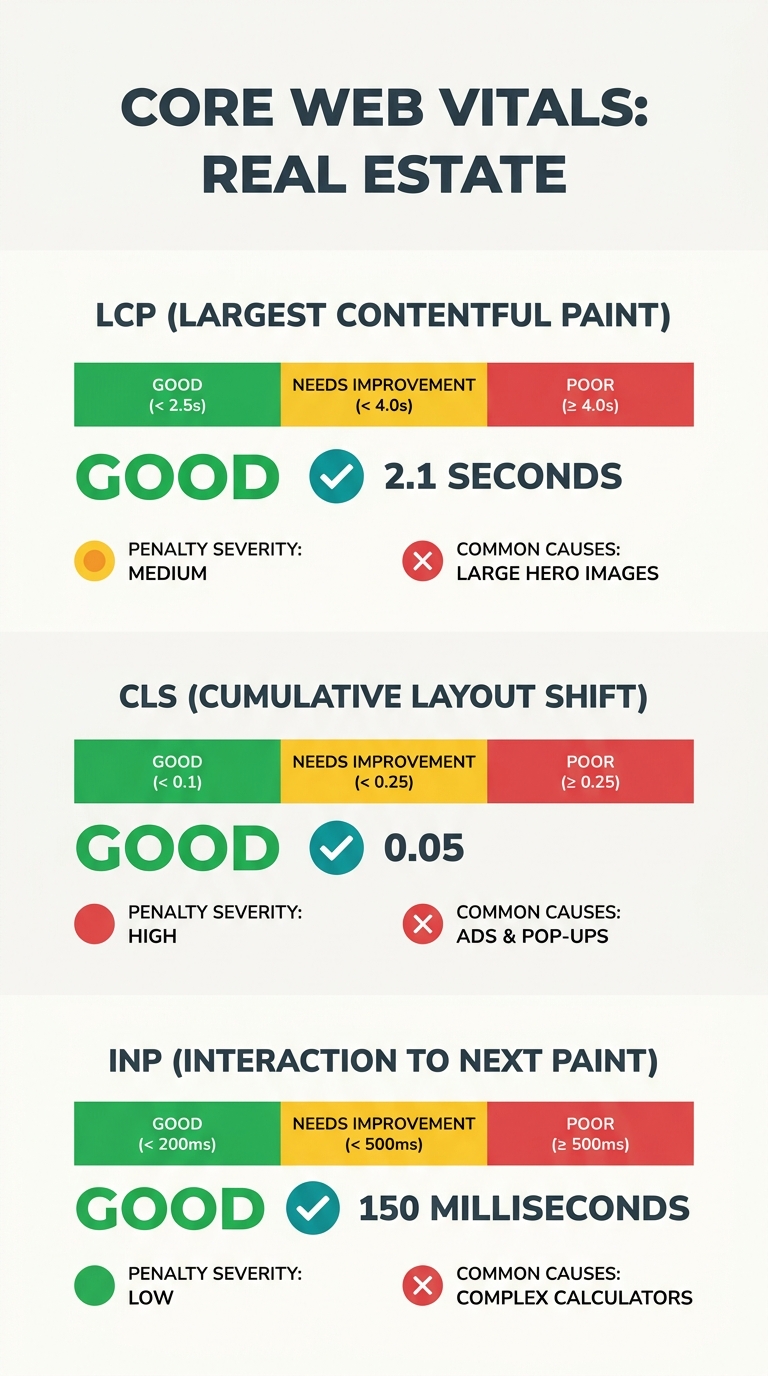
The three real estate website performance metrics Google groups under Core Web Vitals look like a single scorecard, but each metric taxes your lead pipeline differently. LCP measures how quickly the largest visual element appears. CLS measures how much the layout shifts during loading. INP measures how fast the site responds when someone taps a filter, clicks a CTA, or submits a contact form. The LCP CLS conversion impact varies for each, and so does the repair cost. Here’s how they compare for agents running website speed benchmarking against local competitors — and where your repair budget should go first.
| Metric | What It Measures | “Good” Threshold | Ranking Impact If Failed | Primary Real Estate Fix |
|---|---|---|---|---|
| LCP | Time to largest visible element | ≤ 2.0 seconds | 2–4 position drop | Hero image compression, server response |
| CLS | Visual stability during load | ≤ 0.1 | Indirect (higher bounce rate) | Image dimensions, font loading order |
| INP | Response time to user interaction | ≤ 200 milliseconds | ~0.8 position drop | JavaScript cleanup, third-party script audit |
The LCP Problem — Blank Screens Push Buyers to Zillow
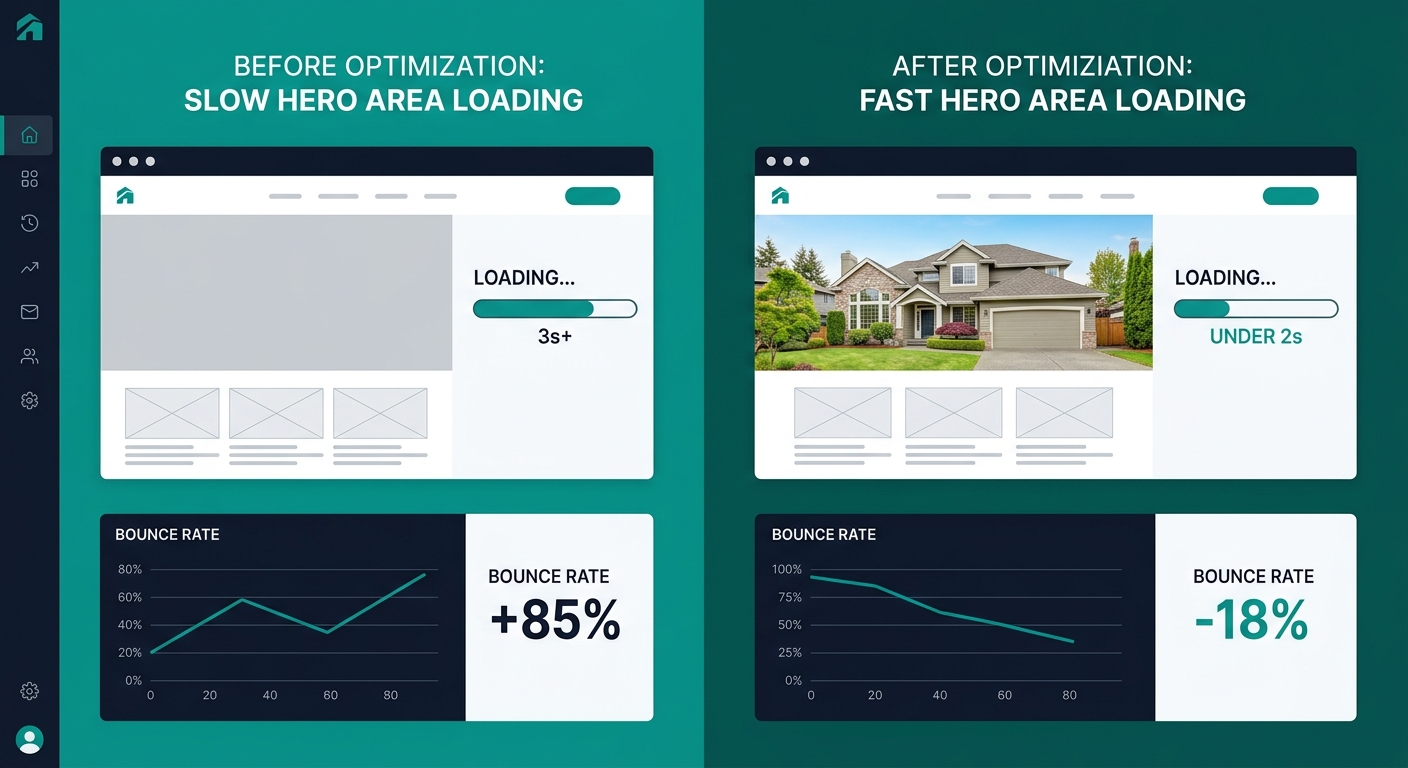
Largest Contentful Paint measures how long a visitor stares at an incomplete screen before the main visual element renders. For most agent sites, that element is a hero photo or listing image gallery — the exact content buyers came to see. When that image takes 3 or more seconds to appear, the probability of a bounce rises 32% compared to a 1-second load. On mobile connections where the majority of property searches happen, those seconds stretch further.
The March 2026 threshold change made this dramatically more punishing. Google previously accepted 2.5 seconds as “good” LCP. The new bar sits at 2.0 seconds, and good practice targets now recommend TTFB under 200 milliseconds as the server-side foundation for hitting that number. For a local keyword like “homes for sale in [your city],” dropping from position 3 to position 6 often means falling below the fold entirely. And since organic results now sit mid-page beneath AI Overviews and paid ads, every lost position compounds.
A Venue.cloud analysis of conversion-focused design noted that “a dramatic hero section that takes too long to appear can leave a blank or incomplete screen for crucial first seconds,” and flagged real estate agent sites specifically as frequent offenders because they depend on large photography to sell the experience.
The fix is direct: convert hero images and listing photos to WebP or AVIF format, preload the LCP element in your page’s head tag, and make sure your hosting provider delivers a server response time (TTFB) under 200 milliseconds. If your site runs on IDX with thousands of listings, that last piece matters more than the image format. When benchmarking IDX tools for high-traffic sites, MLSImport recommends testing with 5,000 to 20,000 listings and measuring time-to-first-byte on both search result pages and individual listing pages — with caching on and off.
Tip: Run Google PageSpeed Insights on your three highest-traffic listing pages and your homepage. If any show LCP above 2.0 seconds, that page is failing Google’s “good” threshold and likely losing ranking positions you won’t see until you check Search Console’s Core Web Vitals report.
CLS Erodes Trust One Layout Shift at a Time
Why does a page that technically loads fast still feel broken to property buyers? Because Cumulative Layout Shift measures something different than speed. CLS tracks how much visible content moves around during and after loading. A “good” CLS score sits at 0.1 or below. Anything above 0.25 falls into the “poor” category, and the range between — 0.1 to 0.25 — earns a “needs improvement” flag.
Real estate sites are uniquely vulnerable to CLS problems. Listing pages load multiple images at different sizes, IDX widgets inject dynamic content, and ad units or mortgage calculator embeds resize after the initial paint. Each of those shifts registers as CLS. When a buyer scrolls through a gallery and the “Schedule a Showing” button jumps 40 pixels down because an image loaded late, that tap misses or lands on the wrong element. The result is friction at the exact moment of highest intent.
The ranking impact of poor CLS is indirect compared to LCP, but the conversion impact is severe. Promodo’s 2026 real estate marketing benchmarks show the average time on page for real estate sites sits at just 1 minute 34 seconds. Within that narrow window, every layout jump shortens the session further. And since 47% of websites currently fail Core Web Vitals assessments overall, sites that nail CLS earn a trust advantage over nearly half the competition.
If you’ve already worked through a visual hierarchy audit of your image galleries, you’ve done part of the CLS fix. The remaining work involves setting explicit width and height attributes on every image element, preloading web fonts to prevent text reflow, and making sure IDX widgets have reserved space in the DOM before their content loads.
Within the 1 minute 34 seconds an average buyer spends on a real estate page, every layout shift pushes them closer to the back button.
INP Punishes Every Slow Filter, Map, and Form
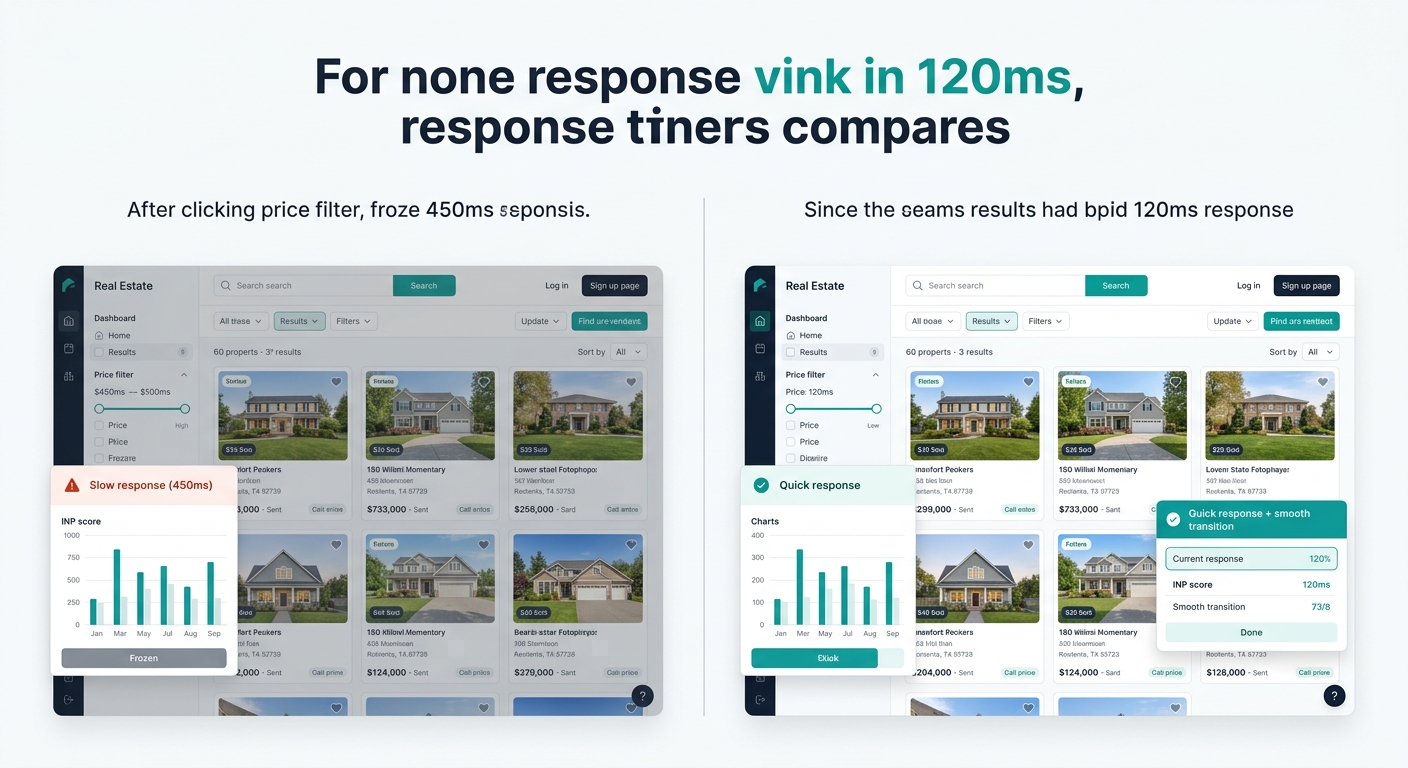
INP — Interaction to Next Paint — became an equal ranking signal alongside LCP and CLS in the March 2026 update, replacing the supplementary status it held previously. Sites with INP above 200 milliseconds have experienced measurable position drops averaging 0.8 places. That sounds small until you multiply it across dozens of indexed listing pages and neighborhood search pages, each losing fractional visibility.
INP measures the delay between a user action (tapping a price filter, clicking a map pin, submitting a contact form) and the browser’s visual response. For agents whose sites rely on IDX search integration with MLS data, the problem concentrates around property search pages. Filter interactions that trigger new API calls while simultaneously re-rendering map markers and thumbnail grids can push INP well past 200 milliseconds — especially on mobile devices with less processing power.
Magnet’s analysis of Core Web Vitals optimization outcomes found that sites achieving “good” scores across all three metrics saw conversion improvements of up to 20%. That number tracks with broader industry data: AgentFire’s review of real estate website metrics notes that load times beyond 5 seconds cause a large chunk of potential clients to leave for a competitor’s site that responds faster.
The INP fix requires an audit of JavaScript execution. Third-party chat widgets, analytics scripts, retargeting pixels, and CRM tracking code all compete for the main thread. Each one adds milliseconds to every interaction. The discipline here is subtraction: remove scripts that don’t directly contribute to lead capture or user experience, defer what remains until after the page is interactive, and break long JavaScript tasks into smaller chunks the browser can process between frames.
If you’ve been evaluating which website builder tools actually drive leads versus draining your budget, INP performance should be a primary filter. A builder that ships 14 third-party scripts on every page load will fail the INP threshold regardless of how well you’ve optimized images.
Which Metric Deserves Your Budget First
The honest answer depends on where your Core Web Vitals real estate scores currently fail. But if you’re triaging blind, fix LCP first.
LCP carries the largest direct ranking penalty (2–4 positions versus INP’s 0.8), it affects every page on your site, and the fixes — image compression, format conversion, server optimization — tend to be one-time investments rather than ongoing maintenance. A site that passes LCP at under 2.0 seconds and still fails CLS and INP will at least show up in search results where buyers can find it. A site that fails LCP may never get the chance to demonstrate its CLS or INP problems because visitors don’t arrive in the first place.
CLS should come second because the fixes overlap significantly with LCP work. Setting image dimensions, preloading fonts, and reserving space for dynamic widgets all improve both metrics simultaneously. And since CLS directly affects whether a buyer successfully taps your contact form or scheduling button, fixing it has an outsized effect on conversion flow from your website into your CRM.
INP is the hardest to fix and the one most agents will need developer help with. JavaScript audits, script deferral, and main-thread optimization require technical skills that image compression doesn’t. But the payoff is real: when your search filters respond in under 200 milliseconds and your contact forms submit without visible delay, buyers stay on your site through that 1 minute 34 second average session window instead of leaving at the 40-second mark.
Warning: Google Search Console’s Core Web Vitals report uses a 28-day rolling window of real Chrome user data. After you make fixes, you won’t see the score update for nearly a month. Don’t assume your changes failed — check PageSpeed Insights for immediate lab data confirmation, then wait for field data to catch up.
The speed tax is real, it’s measurable, and it’s different for every agent site. Run PageSpeed Insights on your five highest-traffic pages today, note which of the three metrics fails, and start with the column in the comparison table above that matches. Every week you delay is another week of invisible lead loss to competitors whose sites load a half-second faster than yours.