

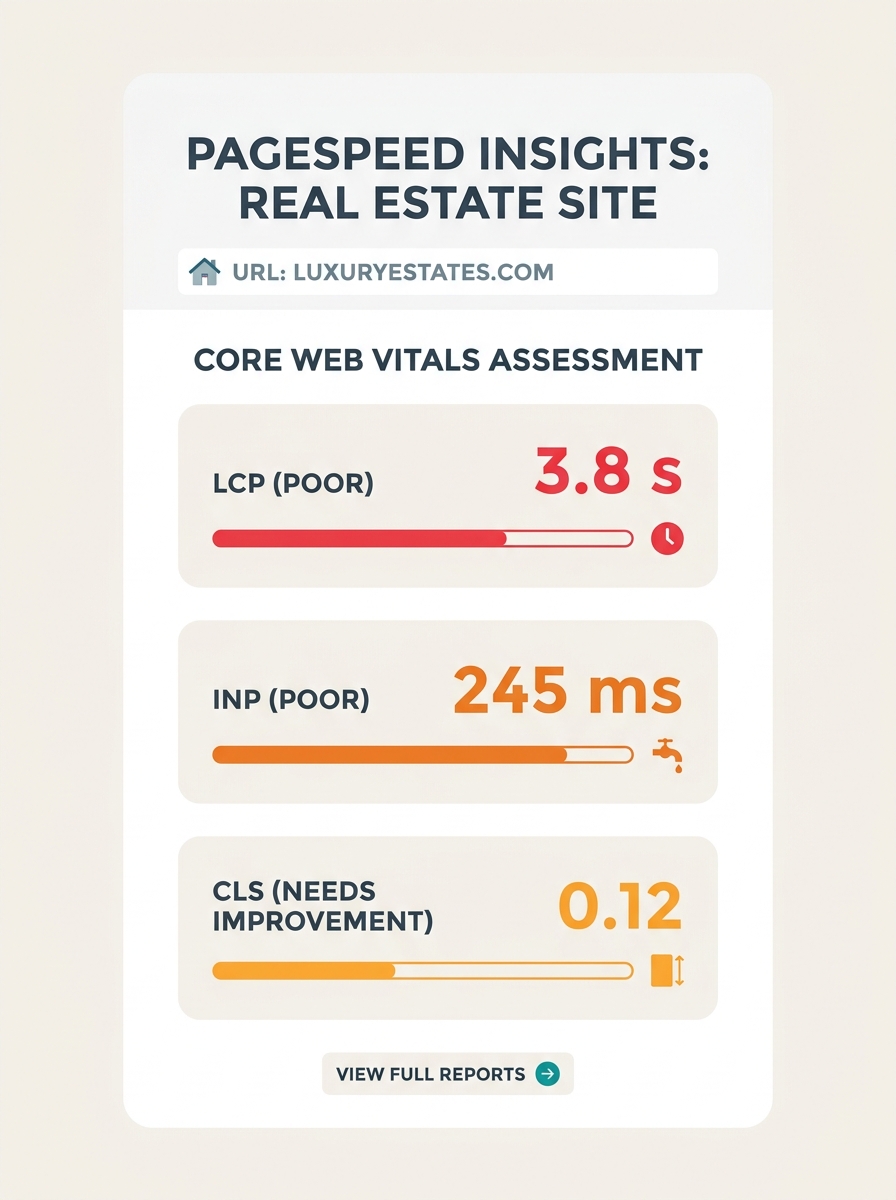
Google’s Core Web Vitals grade your real estate website on three metrics: how fast the largest visible element loads (LCP), how quickly the page responds to a tap (INP), and how much the layout shifts during loading (CLS). Failing any one of these quietly kills leads before visitors see a single listing.
TL;DR: Real estate websites that convert at the standard 1–3% often have undiagnosed Core Web Vitals failures pushing that number lower. Fixing LCP through image compression, INP through script deferral, and CLS through layout stabilization recovers mobile leads without increasing ad spend.
The conversion math makes website speed optimization for agents an urgent priority. A typical real estate website converts 1–3% of visitors into leads. The average lead-to-buyer conversion rate in real estate sits at 4–12%, meaning for every 1,000 leads, only 40 to 120 become actual buyers. When your site loads slowly on a phone, those already-thin numbers shrink further. Visitors bounce before they reach your contact form or property search. The leads you’re losing aren’t people who rejected you. They’re people whose phones gave up waiting.
If you’ve already read our breakdown of how Core Web Vitals benchmarking reveals hidden lead loss, you know the problem. This real estate site speed checklist gives you the fixes, in the order you should tackle them.
Measure your field data before you optimize anything
Why does this matter first? Because lab scores and real-user scores tell different stories. Google’s PageSpeed Insights runs a simulated test on controlled hardware. Your actual visitors load your site on 4-year-old Android phones over spotty cellular connections at open houses. The gap between these two experiences is where leads disappear.
Go to PageSpeed Insights and enter your website URL. Look at the field data section at the top, not the lab data below it. Field data comes from the Chrome User Experience Report (CrUX), which aggregates real visitor experiences over a rolling 28-day window. If your field data shows LCP above 2.5 seconds, INP above 200 milliseconds, or CLS above 0.1, you’re failing that metric for a meaningful share of visitors.
If you don’t have enough traffic to generate CrUX data, install a Real User Monitoring (RUM) script. Services like web-vitals.js from Google collect the same three metrics from every visitor and report them back to your analytics. You can’t fix what you haven’t measured with actual user data.
Tip: Run PageSpeed Insights on your homepage, your most-visited listing page, and your neighborhood landing page separately. Each page type will have different bottlenecks. Your listings page with 40 property photos will score differently than your contact page.
Compress and lazy-load every listing photo
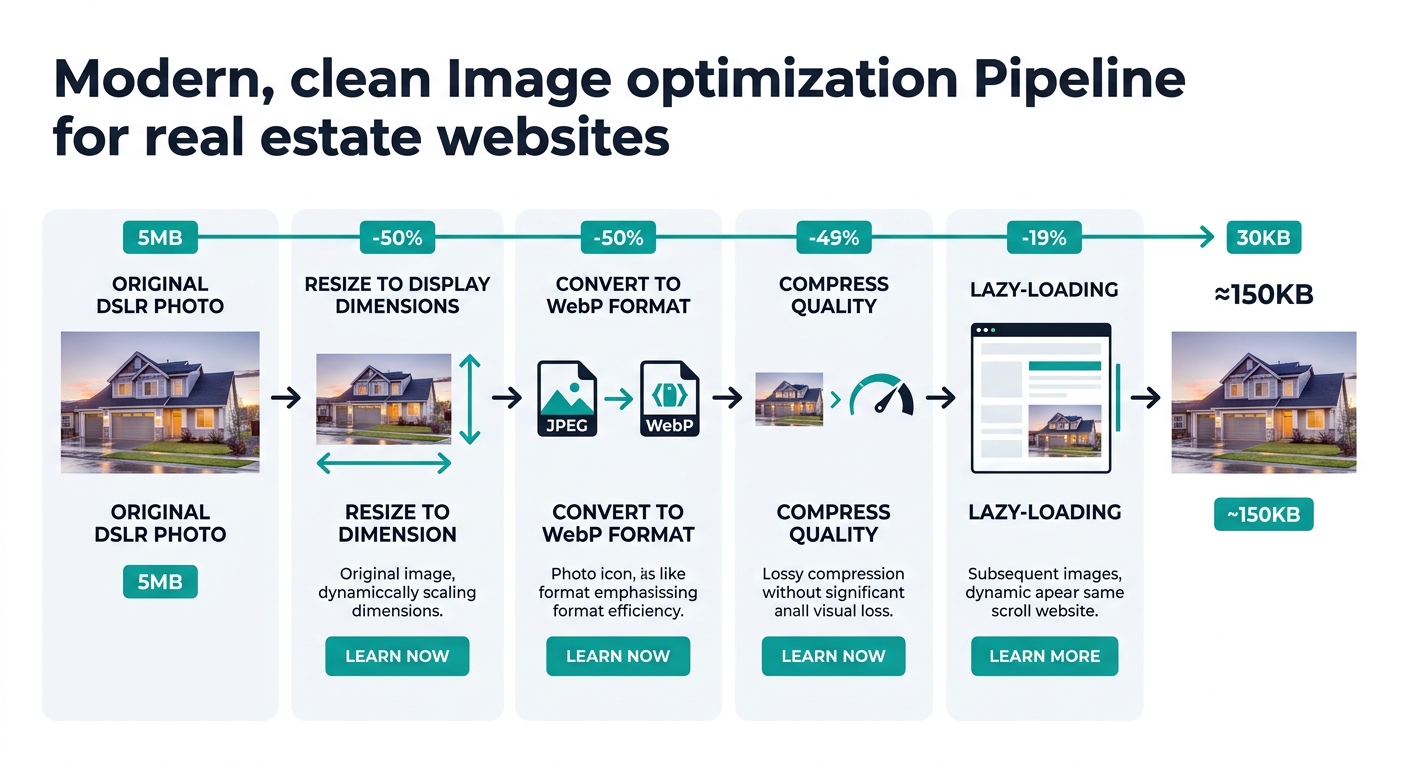
High-resolution property photos are the single biggest contributor to slow LCP on real estate sites. A 12-megapixel DSLR image exported at full quality weighs 3–8 MB. Multiply that by 20 photos on a listings page and you’re asking visitors’ browsers to download 60–160 MB before they can interact with anything.
The 2026 Core Web Vitals checklist from corewebvitals.io puts image optimization at the top of its recommendations, covering format conversion, dimension right-sizing, and lazy loading as the highest-impact changes most sites can make.
Convert every image to WebP or AVIF format. WebP delivers roughly 25–35% smaller file sizes than JPEG at equivalent visual quality. AVIF pushes that savings to 50% or more. Set explicit width and height attributes on every image tag so the browser reserves space before the image loads (this prevents CLS, too). And apply lazy loading to every image below the fold so the browser only downloads photos as visitors scroll toward them.
Your hero image or first listing photo is the exception: that image should load eagerly because it’s almost certainly your LCP element. Preload it in the HTML head so the browser starts fetching it before it even parses the rest of the page.
Defer or remove third-party scripts that block interaction
IDX feeds, chat widgets, analytics trackers, retargeting pixels, CRM pop-ups, social sharing buttons. A typical real estate website loads between 15 and 40 third-party scripts. Each one competes for the browser’s main thread, and when that thread is busy executing JavaScript, the page can’t respond to taps or clicks. That’s how INP (Interaction to Next Paint) fails, and it’s a direct cause of lead loss on mobile.
As Sierra Interactive’s documentation on real estate website speed puts it, fast load times improve “SEO, user experience and lead conversion rates.” When a buyer taps your “Schedule a Showing” button and nothing happens for 400 milliseconds, they tap again, get confused, and leave.
Audit your scripts by opening Chrome DevTools, going to the Performance tab, and recording a page load. Look for long tasks (anything over 50ms) on the main thread. The usual culprits on real estate sites are live chat widgets that initialize on page load, IDX search scripts that parse the full MLS dataset upfront, and multiple analytics trackers firing simultaneously. If you’re running both Google Analytics and a Facebook pixel and a CRM tracker and a heatmap tool, you likely have 4 scripts doing similar work.
For every script you identify, ask: does this need to run before the visitor can interact? If not, add the “defer” or “async” attribute. For chat widgets specifically, delay initialization until the visitor scrolls or hovers near the chat icon. This alone can cut 200–500ms off your INP.
The leads you’re losing aren’t people who rejected your value proposition. They’re people whose phones gave up waiting for your JavaScript to finish executing.
Lock down layout shifts on your property detail pages
CLS measures how much content jumps around as the page loads. On a real estate site, the three biggest shift triggers are images without declared dimensions, late-loading ad banners, and web fonts that swap in after system fonts have already rendered the text. Each shift pushes the content a visitor was about to tap into a different position.
Picture a buyer scrolling through a property detail page. They’re about to tap “Request Info” when a photo carousel loads above the button, pushing it 300 pixels down the screen. They accidentally tap a different listing. That’s a lead gone, and you’d never see it in your analytics because no click event registered on the form.
Fix layout shifts with three changes. First, set explicit width and height on all images and video embeds so the browser reserves that space immediately. Second, reserve fixed-height containers for any element that loads asynchronously, like ad banners, map embeds, or IDX widgets. Third, use “font-display: swap” in your CSS but preload your primary font file so the swap happens almost instantly.
This matters especially if you’ve redesigned your homepage for how buyers actually browse, since a well-organized layout loses its value if elements keep jumping during load.
Serve your pages from a CDN near your farm area
Server response time is the foundation under all three Core Web Vitals metrics. If your server takes 800ms to generate an HTML response, your LCP cannot possibly score below 800ms, and everything downstream gets delayed proportionally.
The Reddit SEO community’s Core Web Vitals checklist names three server-side priorities: upgrading to a faster host, routing users to a nearby CDN node, and applying server-side caching. For real estate agents farming a specific metro area, the CDN piece matters enormously. If your server sits in Virginia and your buyers are in Phoenix, every request travels 2,000+ miles each way.
HTTP/3 with QUIC protocol delivers 20–30% improvements in LCP on mobile networks by eliminating head-of-line blocking, according to performance research cited by Brave’s web index. That improvement compounds with CDN proximity. A CDN node in your metro area serving HTTP/3 responses can shave a full second off your LCP compared to a distant origin server on HTTP/2.
Google’s page experience signals now combine Core Web Vitals with mobile-friendliness, safe browsing, HTTPS security, and interstitial guidelines as ranking factors. You need all of them, but server speed is the one that cascades into everything else.
Test on the phones your actual buyers carry
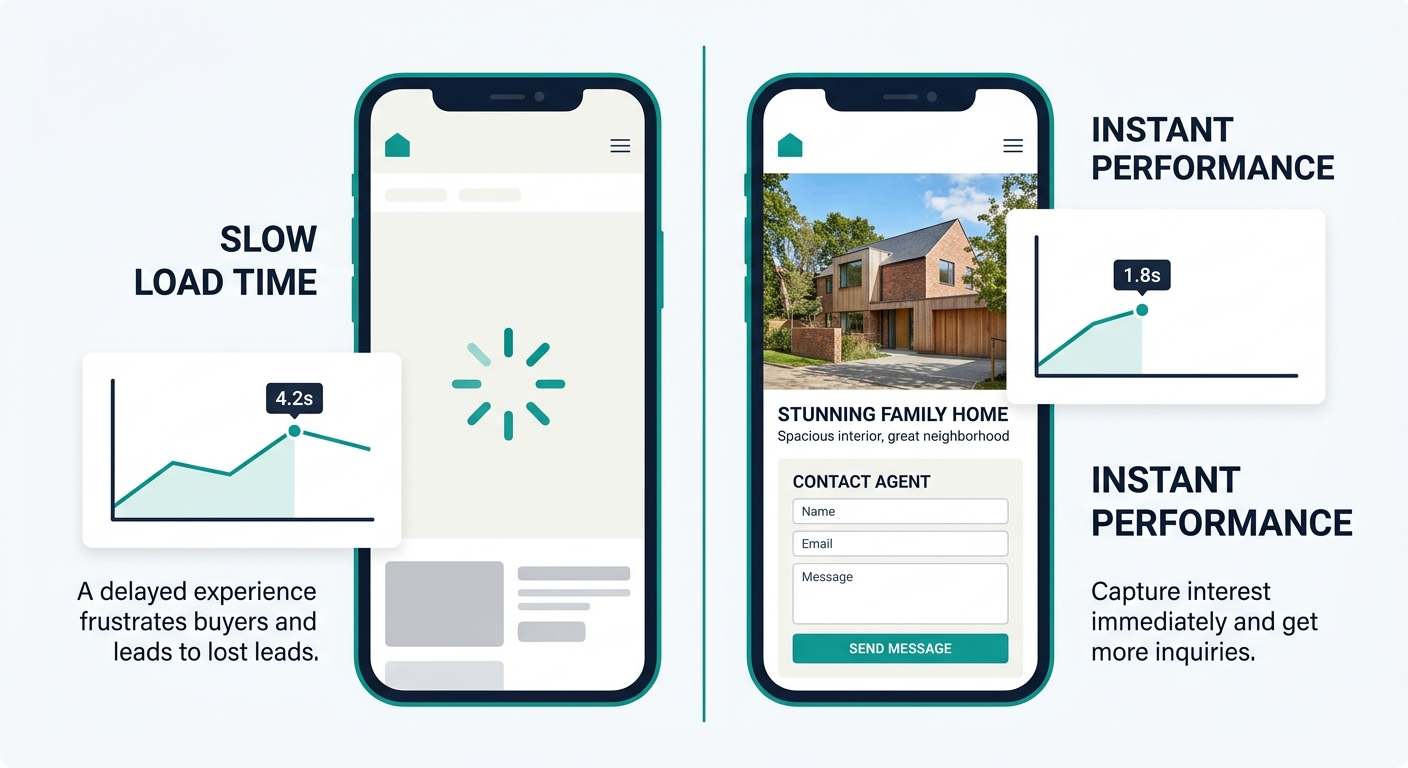
Performance testing on your MacBook Pro with gigabit fiber tells you almost nothing about how a first-time homebuyer experiences your site on a Samsung Galaxy A15 over an LTE connection. The gap between developer hardware and consumer hardware is the gap between your lab scores and your field scores.
Real estate websites lose the most leads on mobile, and the loss compounds with device age. If your site’s mobile navigation is already costing you leads through poor UX patterns, slow Core Web Vitals on top of that create a double penalty.
Chrome DevTools lets you throttle CPU performance to 4x or 6x slowdown and simulate a “Slow 3G” or “Fast 3G” network connection. Test your site under those conditions. If your listing page takes more than 4 seconds to show the first property photo at 4x CPU throttle on Fast 3G, mid-range Android users in your market are getting that experience right now. The Tokopedia case study showed a 23% uplift in average session duration from a 55% improvement in LCP achieved through server-side rendering and image optimization. Session duration on a real estate site directly correlates with form submissions and scheduled showings.
Warning: If you use a website builder platform, your control over some of these optimizations may be limited. As Optimizely’s documentation notes, “any customizations you have may affect the scores, and [the platform] is not responsible for all scenarios.” Check which performance settings your builder exposes before assuming the platform handles everything.
When These Rules Compete With Each Other
You’ll hit tradeoffs. Your CTA placement strategy might call for a lead capture pop-up that adds JavaScript and causes layout shifts. Your IDX integration loads a search widget that blocks the main thread for 300ms. Your professional listing photos look incredible at high resolution but destroy your LCP.
The tiebreaker is always the same: optimize for the page that receives the most organic search traffic first, because that page determines your real estate website performance benchmarks in CrUX data. Google uses origin-level (whole-site) CWV assessments, but the pages with the most visits contribute the most data points. Fix your highest-traffic pages and your overall CWV assessment improves disproportionately.
When a feature genuinely conflicts with a performance target, A/B test the tradeoff. Run the page with the chat widget deferred for two weeks and compare lead form submissions against the version with the widget loading immediately. Let the conversion data settle the argument, because the right answer varies by market, by audience, and by how your site is built.