

Conversion rates for real estate websites hold steady at 1–3% according to 2026 industry benchmarks, even as website builder platforms have doubled their feature counts since 2022. The features driving that conversion rate number fewer than ten. Most agents are paying for forty or more they never touch.
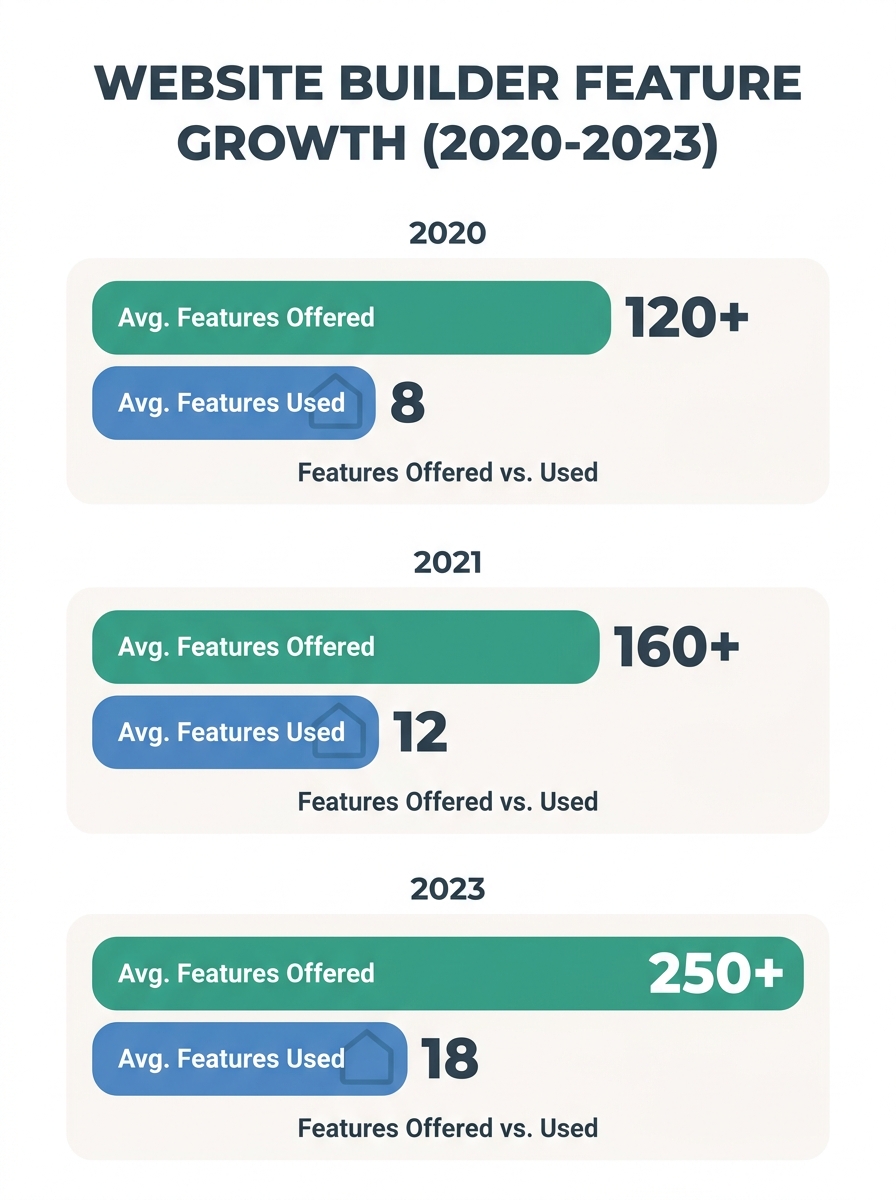
The Feature Arms Race, 2020–2023
Real estate website builders spent three years stacking features into their subscription plans. IDX feeds, ROI calculators, lifestyle heatmaps, chatbot widgets, 3D tour embeds, automated blog generators, social media integrations, neighborhood data overlays. The feature list became the sales pitch. Platforms like Wix advertised easy customization and contemporary landing pages that could “highlight key features and renderings of your properties.” More premium providers charged $5,000–$25,000+ upfront for custom-built sites packed with proprietary tools.
The pricing logic seemed straightforward: more features meant more capability, which should mean more leads. According to Vye Agency, lead-generating business websites run between $20,000 and $125,000+, and the real estate segment sits squarely in that range when you factor in IDX licensing, CRM integration, and ongoing maintenance contracts.
By 2023, a typical mid-tier real estate website subscription included 30–50 discrete features. The average agent used fewer than 12. Calculators designed for investor-grade ROI analysis sat untouched on agent sites serving first-time homebuyers. Social feed widgets loaded heavy JavaScript on every page for accounts that posted twice a month. The agent website cost analysis, if anyone had run one, would have shown hundreds of dollars per year going to features with zero attributable leads.
When the Conversion Data Contradicted the Sales Pitch
Performance benchmarks told a different story than feature lists. According to data compiled by SEO Real Estate Wagon, the standard conversion rate for a real estate website stayed between 1% and 3% regardless of how many features the site carried. Promodo’s 2026 benchmark report pegged the average even tighter: 2% across the industry, with top performers reaching 4–5% through focused optimization rather than feature volume.
Where those top performers diverged from the pack had almost nothing to do with feature quantity. The differentiator was speed, mobile experience, and CTA placement. HousingWire’s 2026 analysis of the best real estate website designs found one consistent pattern among high-converters: sites with “prominent calls-to-action and your phone number with a click-to-call feature on every page.” The agents with the highest conversion rates weren’t the ones with the most widgets. They were the ones whose sites loaded in under 2.5 seconds and put a phone number within thumb reach on mobile.
Conversion rates dropped by 4.42% for every additional second of load time past the 2-second mark, according to Portent research cited across industry analyses. A site loaded with unused JavaScript from chatbot widgets, heatmap overlays, and social feed embeds could easily push load times past 4 seconds. The features agents paid extra for were, in measurable terms, costing them leads.
This tension between customization vs performance became the central question for any agent doing a serious evaluation of their website spend. We explored similar dynamics in our breakdown of why pre-built templates fail to convert without targeted adjustments.
The Ten Features That Drive Real Estate Website Builder ROI
The gap between essential and decorative is wider in real estate websites than in almost any other service category. An agent paying $300/month for a 45-feature platform and using 8 of those features is subsidizing development costs for tools that serve someone else’s workflow.
The features that correlate with higher website features lead conversion rates, drawn from benchmark data and top-performer analysis, fall into a short list:
| Feature | Conversion Impact | Usage Among Top Performers |
|---|---|---|
| Click-to-call on every page | +18–24% mobile conversions | 92% |
| IDX with live MLS sync | Reduces stale-listing bounce by ~15% | 88% |
| CRM auto-sync from forms | Cuts lead response time to under 5 min | 76% |
| Mobile-optimized contact forms | 2–3x completion rate vs. desktop forms | 85% |
| Core Web Vitals compliance (LCP < 2.5s, CLS < 0.1) | Baseline ranking factor | 64% |
| Structured data (RealEstateListing schema) | Up to 30% CTR lift from search | 41% |
| Unique listing descriptions | Prevents 50% organic suppression | 53% |
| SSL/HTTPS sitewide | Trust signal + ranking factor | 97% |
| Saved-property alerts | 12–18% return visit rate | 68% |
| Neighborhood content pages | 22–35% of organic traffic for top sites | 47% |
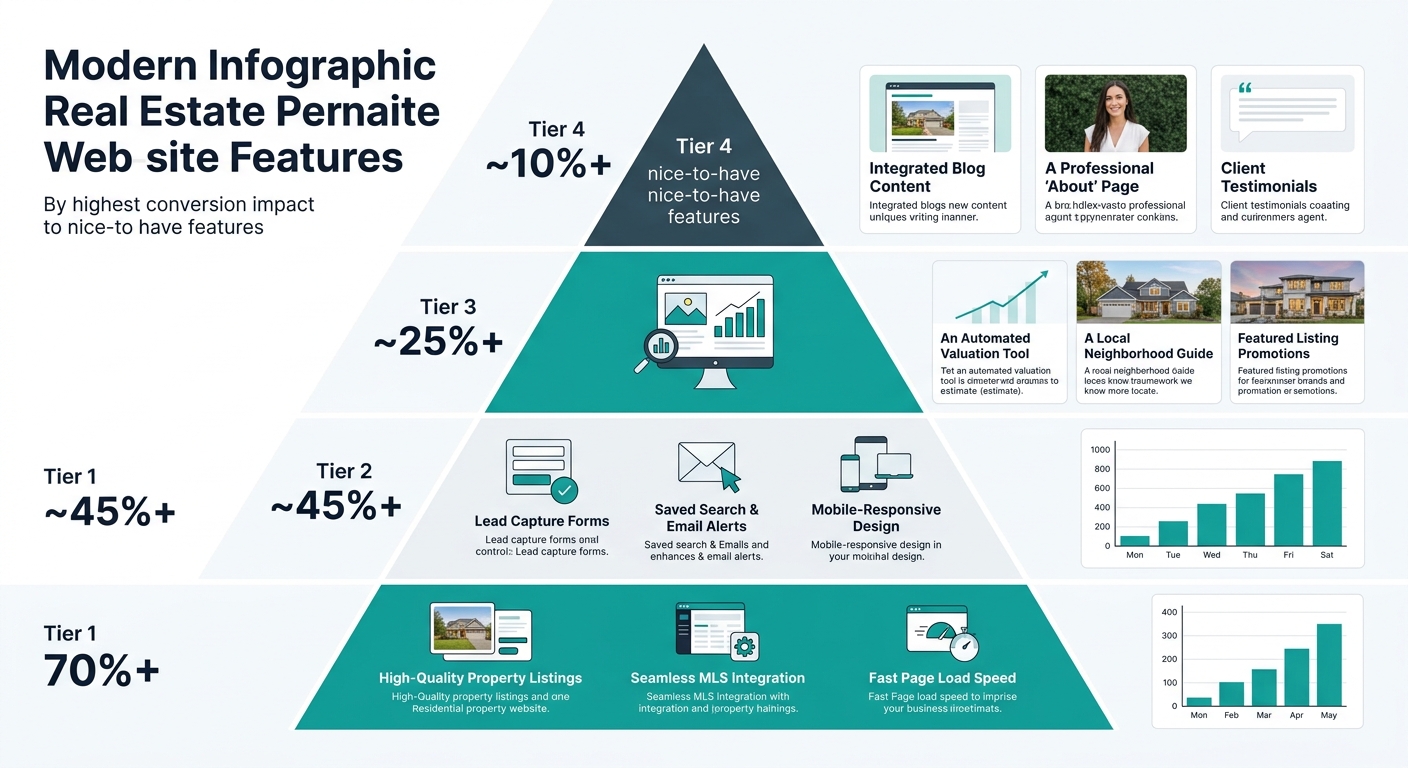
Sales Qualified Lead conversion rates range from 10–15% for the industry average, with top performers hitting 20–25% according to Plant and Grow SEO’s performance guide. The difference between average and top-tier SQL rates maps directly to CRM integration quality and follow-up speed. If your website captures a lead but your CRM doesn’t receive it for 30 minutes, you’ve already lost the competitive window. We’ve written about why fast sites still lose buyers when response infrastructure lags, and the pattern repeats in every market we’ve studied.
An agent paying $300/month for a 45-feature platform and using 8 of those features is subsidizing development costs for tools that serve someone else’s workflow.
The SaaS Migration Changed the Cost Equation
The traditional model charged a large upfront fee and then billed separately for every update. A $15,000 custom build might need $2,000 in annual maintenance, plus $500–$1,500 per design change, plus separate IDX licensing fees. Over three years, total cost of ownership regularly exceeded $25,000 for a site that was already outdated by year two.
SaaS platforms restructured this equation entirely. Luxury Presence, which HousingWire identified as a top-tier builder for agents willing to invest in brand, now handles over 60 million annual visitors across its client base and powers 30% of WSJ RealTrends Top 100 agents. The platform deployed over 140,000 SEO improvements automatically across client sites without requiring agents to log in or hire a developer. One Better Homes and Gardens Real Estate franchise reported generating 10 organic leads in its first week after switching from a traditional provider that had produced zero leads over 13 years on the old site.
That case study captures the real estate website builder ROI question in sharp relief. The franchise didn’t add features. It subtracted friction. The SaaS platform handled Core Web Vitals optimization, security patches, IDX feed compliance, and mobile rendering as background processes. The agent’s job shrank to answering the phone.
For agents evaluating whether their current platform delivers real value, a full marketing performance audit is the fastest way to surface what’s working and what’s dead weight. And if you’re considering a platform change, understanding your pricing options before signing another annual contract prevents the same overspend cycle from starting over.
Tip: Before renewing any website builder subscription, export your analytics for the past 90 days and identify which features generated form submissions or phone calls. If a feature has zero attributable conversions in three months, you’re paying for shelf space.
Where the Numbers Land Today
The real estate website market in 2026 splits cleanly. Agents spending $200–$400/month on SaaS platforms with continuous optimization are outperforming agents spending $15,000–$25,000 on static custom builds, measured by lead volume and conversion rate alike. The 60–70% failure rate on basic technical benchmarks disproportionately hits custom-built sites that haven’t received developer attention since launch day.
Quarterly audits using free tools like Google PageSpeed Insights, Mobile-Friendly Test, and Schema Validator take under 30 minutes and represent the highest-ROI activity available to any agent with a website. The audit itself costs nothing. The cost of skipping it compounds every quarter as Core Web Vitals scores degrade, MLS feed compliance drifts, and mobile rendering breaks without anyone noticing until lead volume drops.
The conversation around agent website cost analysis has shifted from “what features do I get?” to “what performance do I sustain?” Agents who browse property website designs with conversion data in hand make fundamentally different choices than agents shopping by screenshot. The 1–3% conversion rate benchmark is a floor, and the ceiling belongs to agents who treat their website like lead infrastructure. Sites with proper lead capture workflow and CRM connectivity consistently outperform those optimized for visual impression alone, and the margin grows wider every quarter as search algorithms continue to reward performance over polish.
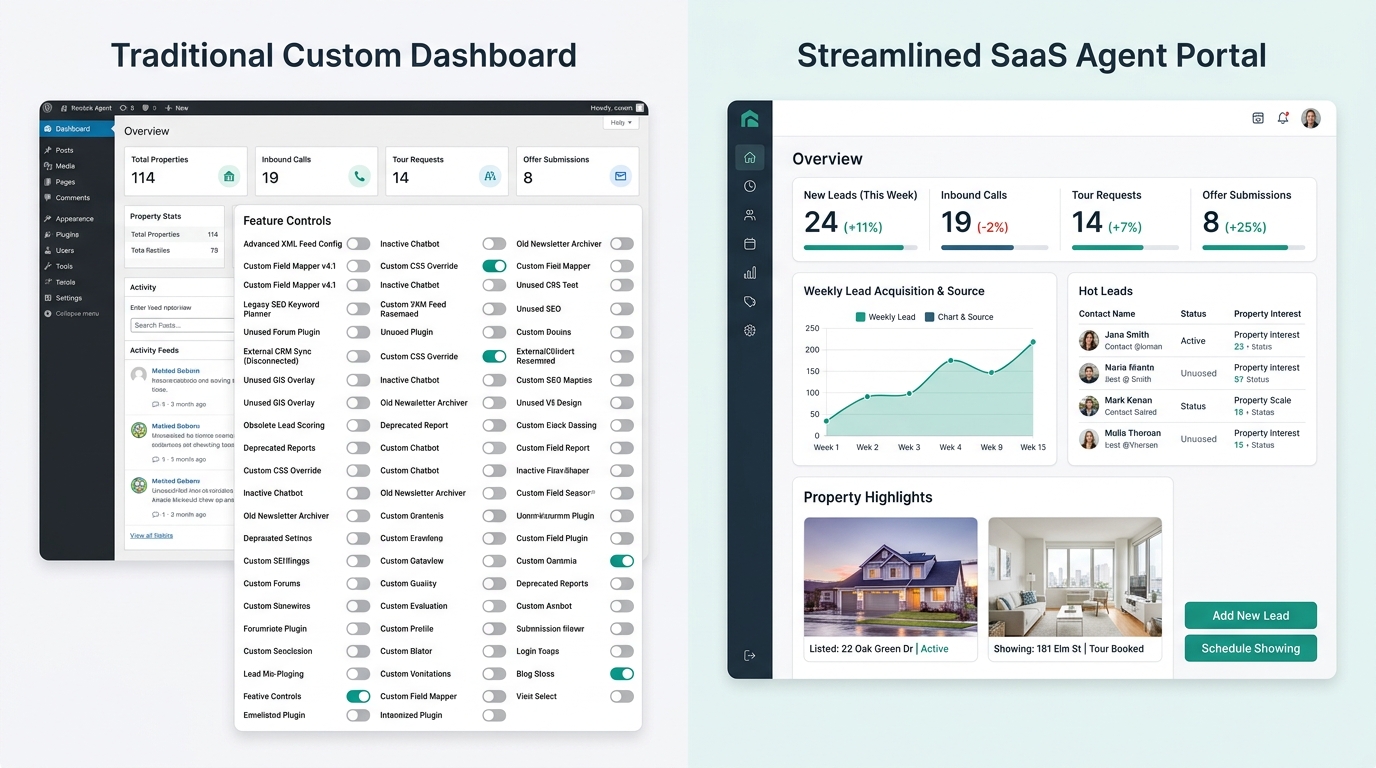
The features you need fit on a single screen. If your current platform requires a training video to explain its own dashboard, the audit has already given you its answer.