
Matterport scans for a 2,500-square-foot home cost between $200 and $350, pull far more clicks than static photo galleries, and routinely fail to produce a single scheduled showing. The disconnect between virtual tour engagement and actual lead generation has a structural explanation, and fixing it requires changing what happens inside the tour, not after it.
The Numbers That Create the Paradox
Listings with 3D virtual tours see 80% higher conversion rates and 260% more time on page compared to listings without them, according to Scene3D’s analysis of marketing ROI. On the surface, those numbers suggest 3D property tours lead generation is a solved problem. But the “conversion” Scene3D measured was time-on-page and click-through to inquiry forms, not closed transactions or booked showings. That distinction matters enormously, and it’s where the paradox lives.
Research published in Computers in Human Behavior found that immersive navigation produces more positive emotions (measured via EEG) and more intense physiological arousal (measured via skin conductance) than non-immersive browsing. The study’s authors reported that immersive experiences generated “higher scores on the presence questionnaire and higher scores on the UX questionnaire compared to the non-immersive one.” Buyers feel more present, more emotionally connected to a property they’ve toured in 3D. And then they leave. They don’t fill out the contact form, they don’t call the listing agent, and they don’t book a visit. The emotional arousal that immersive technology generates doesn’t automatically translate into action, because the tour gives them no mechanism to act while that arousal is at its peak.
This is where most agents stop analyzing. They see the tour engagement metrics in their real estate analytics dashboard, assume the tool is working, and blame other factors when leads don’t materialize. The actual gap sits inside the tour experience itself, in the space between the last room a buyer clicks through and the moment they’re supposed to do something about it.
What the Tour Is Missing
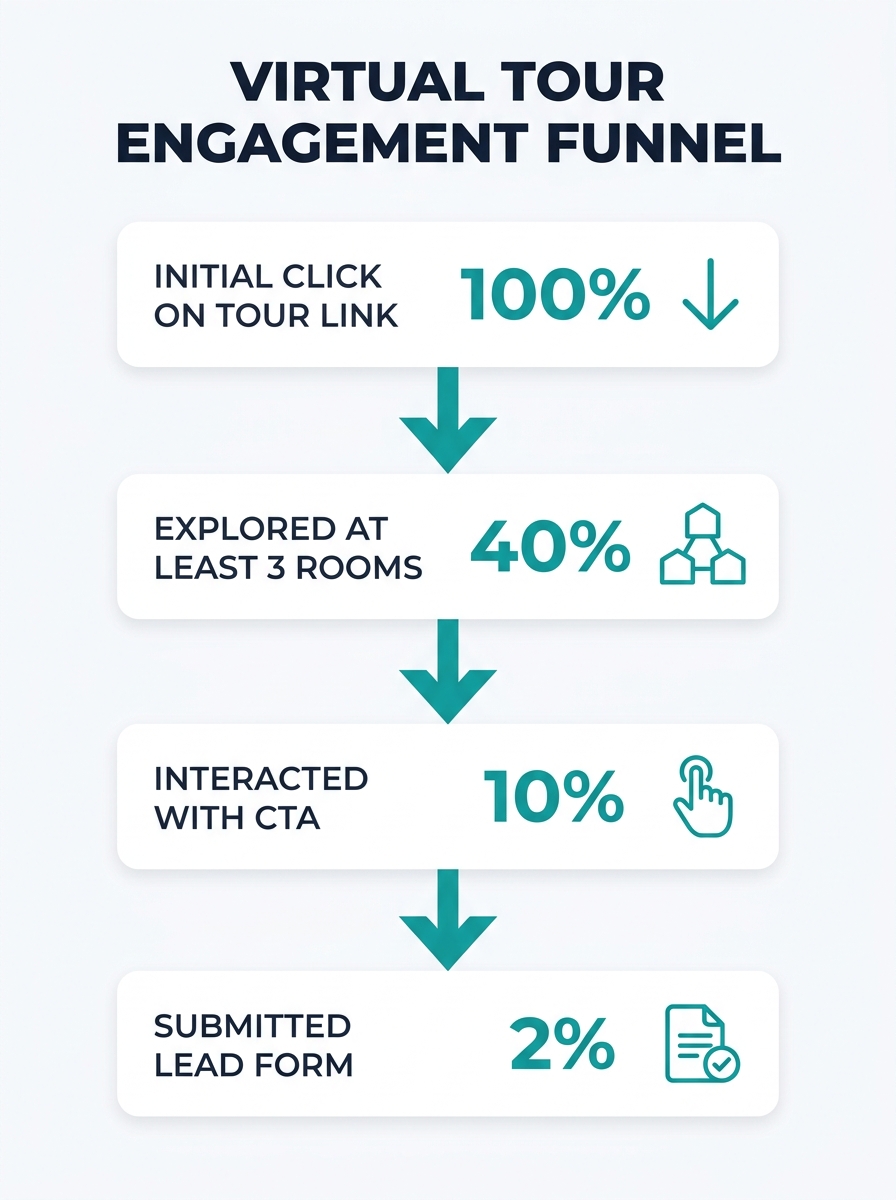
The typical real estate virtual tour is a passive experience. A buyer opens the Matterport link, clicks through 8 or 12 rooms, admires the kitchen countertops, and closes the tab. The tour gave them information but asked nothing in return. Concept3D’s research on interactive tour elements found that tours with embedded hotspots, forms, and video nearly double average session duration, pushing time on tour from 3 minutes 30 seconds to 6 minutes. That additional time correlates with a meaningful behavioral shift: 70% of visitors who encounter interactive elements complete the full tour, visiting an average of 6.68 out of 8 or more stops.
The type of hotspot matters. Links to additional tour stops draw a 21.05% click rate, embedded videos draw 20.14%, and text descriptions pull 17.92%. Those numbers reveal something important about immersive technology buyer intent: buyers who are already inside a 3D walkthrough want more context, not less. They want information about the neighborhood, the school district, the renovation history. A bare 3D scan without interactive layers treats the tour as a destination when it should function as a funnel. SeekBeak’s guidance on virtual tour ROI recommends that agents “assign each hotspot a clear purpose, stacking Actions for compound interactions” including CRM webhooks and guided flows. Tour engagement metrics in real estate become useful only when each interaction point inside the tour maps to a measurable outcome.
Buyers who make it past three rooms are substantially more committed. Placing your scheduling link at stop three or four catches them at peak intent.
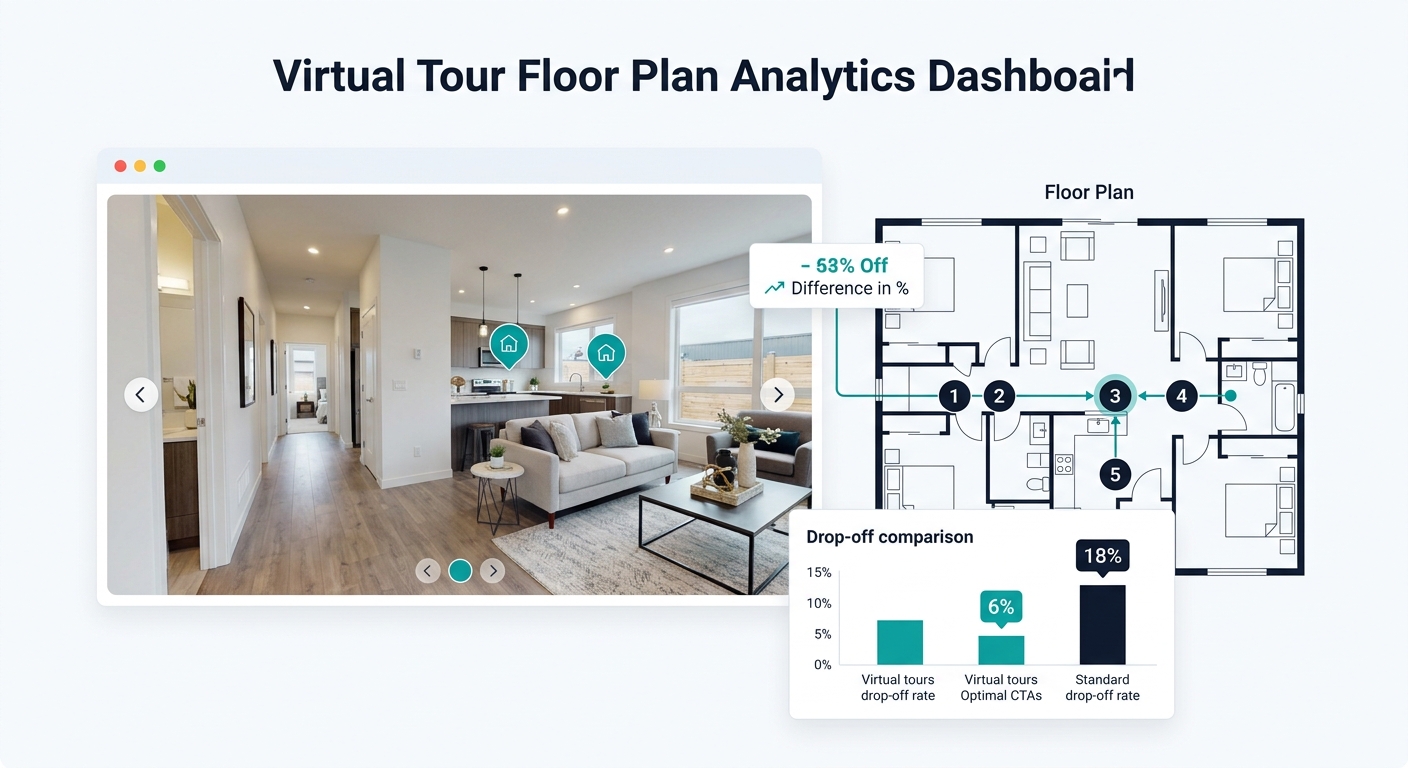
Placement of calls to action within the tour follows a specific logic. Data from Concept3D shows that drop-off rates hit 17% to 18% in the first two stops of a tour but fall to just 6% by the third stop. Buyers who make it past three rooms are substantially more committed. Placing a scheduling link, a contact form, or a financing calculator at stop three or four catches users at peak intent rather than asking for commitment before they’ve invested enough attention to care. Most agents bury their CTA on the listing page itself, somewhere below the tour embed, where a buyer who spent six minutes inside a 3D walkthrough will never scroll.
Connecting the Tour to the Pipeline
A virtual tour that captures attention but doesn’t feed data into your CRM is an expensive brochure. Professional tours run $100 to $360 on average, with full Matterport packages ranging from $130 to $430 depending on square footage. Photographers bundling photos, floor plans, and 3D tours charge $475 to $499 per listing at the higher tiers. That investment only pays off when the tour feeds qualified leads into a follow-up system, and EAB’s research on enrollment metrics underscores the point: including virtual tours in email campaigns boosted inquiry rates by 21%, but the lift depended on connecting tour interaction data to downstream contact sequences.
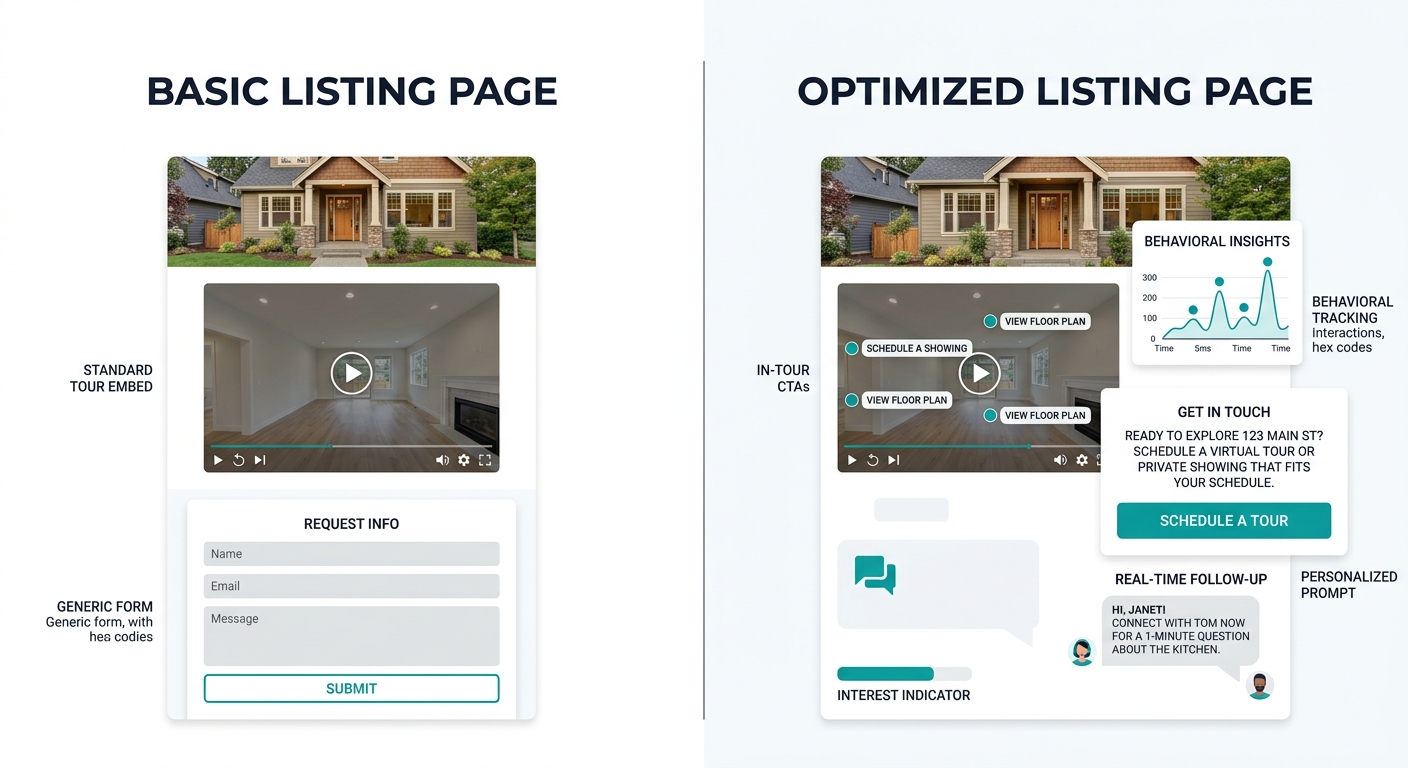
Virtual tour conversion optimization involves three structural changes to how most agents deploy their tours. The tour itself needs interactive elements embedded at calculated intervals, with the first CTA appearing at or after the third stop where drop-off rates have already stabilized at around 6%. The tour platform also needs to pass behavioral data to your CRM so that your follow-up sequence reflects what a buyer actually did inside the walkthrough. Someone who spent 90 seconds in the primary bedroom and replayed the backyard view twice is telling you something specific about their priorities. If your follow-up timing and messaging ignore that behavioral data, you’re treating a warm lead like a cold one. Circuit Blog’s guidance on virtual tour analytics puts it plainly: tracking tour performance means you “focus on user behaviour,” examining “time spent on tours and the number of scenes a user visits during their session.”
And the landing page hosting the tour matters as much as the tour itself. If you’ve seen the conversion leaks common to template-based real estate sites, you know that a gorgeous tour embedded on a page with a generic contact form and no urgency language produces page views, not leads. The bottleneck is the gap between the immersive experience and the next step. A buyer finishes a tour in an elevated emotional state, with more positive affect and higher physiological arousal than they’d get scrolling photos, and the listing page offers them nothing but a cold form asking for their name and email. Agents who’ve already reviewed virtual tour platform options know the technology works. The conversion opportunity evaporates in the handoff between the tour and the form itself.
Where the Certainty Ends
The evidence that interactive, well-placed 3D tours outperform passive ones is strong. The evidence for exactly how much conversion lift a given residential agent should expect from optimizing CTA placement within a tour is much thinner. The 80% conversion lift and 260% time-on-page increase from Scene3D come from commercial office marketing, where a corporate tenant evaluating a 10,000-square-foot lease behaves very differently from a first-time buyer browsing a three-bedroom colonial. The Concept3D data on hotspot click rates, with those 21.05% and 20.14% figures, comes from higher education campus tours, where the visitor’s intent profile differs again. We’re borrowing conversion benchmarks from adjacent industries because residential real estate hasn’t produced its own controlled studies at comparable scale.
What we can say with confidence is that the paradox is real and the mechanism behind it is identifiable. Immersive technology generates emotional engagement that static media cannot match, and the ScienceDirect research confirms this at the neurological level. That engagement creates a window of elevated buyer intent. And most agents let that window close by treating the tour as the end of the marketing sequence rather than the middle of it. The agents who will get the most from their $200 to $430 per-listing investment are the ones who build what happens after the last room click with the same intentionality they put into the scan. Whether the specific conversion numbers from adjacent industries translate proportionally into residential closings remains, for now, a question the industry hasn’t rigorously answered. That gap in the data is itself useful information: it tells you that benchmarking your own tours against your own pipeline outcomes, listing by listing, is the only measurement that will actually matter for your business.