
At 0.99%, the average click-through rate for real estate advertising sits below nearly every other industry vertical that LocalIQ tracks. Pair that with an average cost per lead ranging from $416 to $480 according to 2026 benchmark data from AmpiFire, and a website conversion rate that hovers between 1% and 3% for the typical agent site, and you get a portrait of an industry spending heavily on marketing while consistently underperforming its own benchmarks. The question worth asking isn’t “are agents bad at marketing?” It’s “which specific metrics are dragging scores down, and what would it take to close the gap?”
A competitive performance audit answers that question with numbers rather than guesswork. And the numbers tell a clear story about where the breakdown happens.
The Conversion Rate Gap Between Websites and Landing Pages
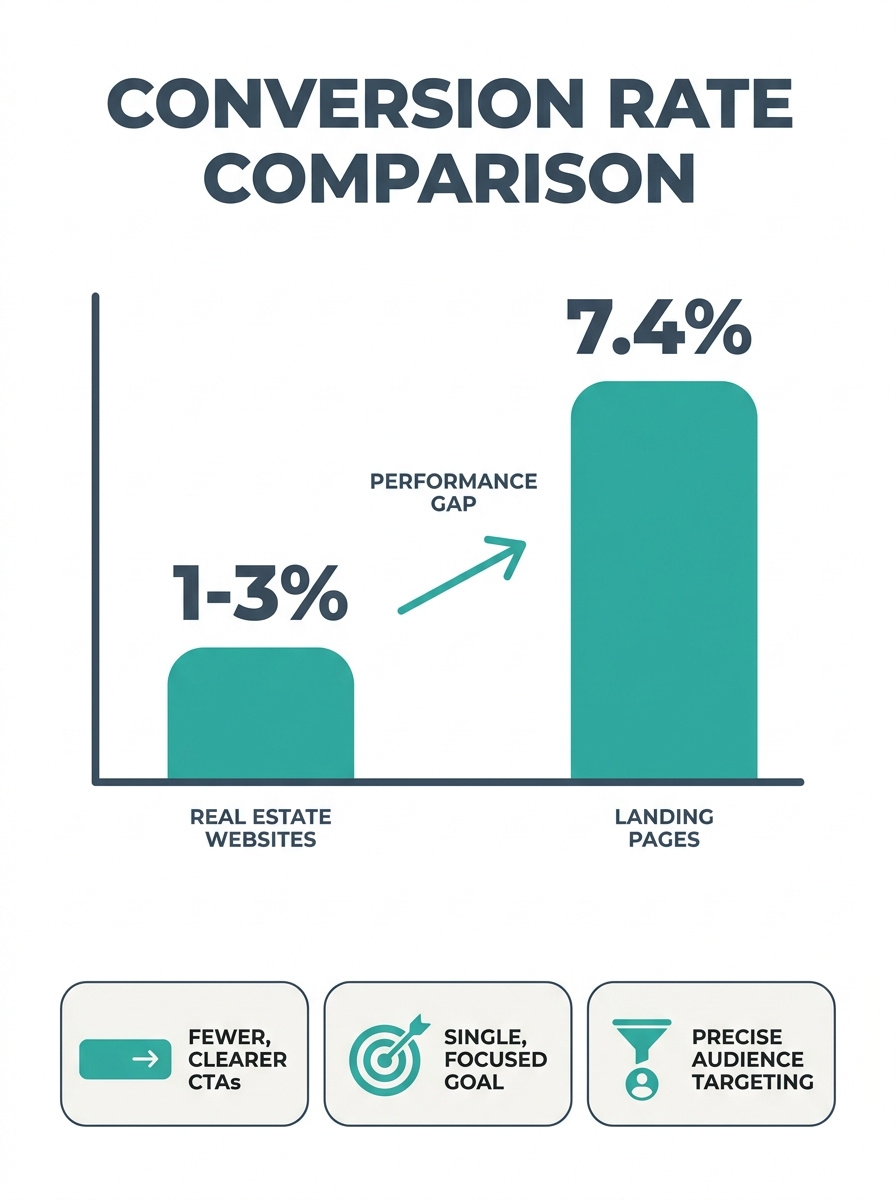
The single most revealing metric in any real estate marketing audit is website conversion rate. The 1–3% range that most agent sites produce sounds reasonable until you compare it to the 7.4% average for real estate landing pages reported by MarketingProfs. That’s a gap of 4–6 percentage points between what a general agent website achieves and what a purpose-built landing page can deliver.
Why does this gap exist? Agent websites try to serve too many audiences at once. They’re part branding brochure, part IDX search portal, part blog, part contact form. Each of those functions competes for attention, and none of them converts well in isolation. Landing pages, by contrast, have a single goal and a single call to action.
If you’ve ever wondered why pre-built real estate website templates often fail to convert without significant customization, this is the underlying math. A template designed to look good doesn’t automatically convert at benchmark rates. The structure of the page, the placement of forms, and the clarity of the value proposition determine whether a visitor becomes a lead.
What “Good” Looks Like for Website Conversion Metrics
Agents who crack 5% website conversion rates share a few common traits. They run fewer pages with sharper intent. Their homepages push visitors toward a specific action within the first scroll. And they test their form design and placement regularly rather than setting it once and forgetting about it.
Top performers also segment traffic. A visitor arriving from a Google search for “homes for sale in [neighborhood]” gets sent to a page built specifically for that search, not dropped onto the homepage to figure things out. This kind of targeting is the difference between a 2% conversion rate and a 6% one.
Where Agent Marketing Dollars Actually Disappear
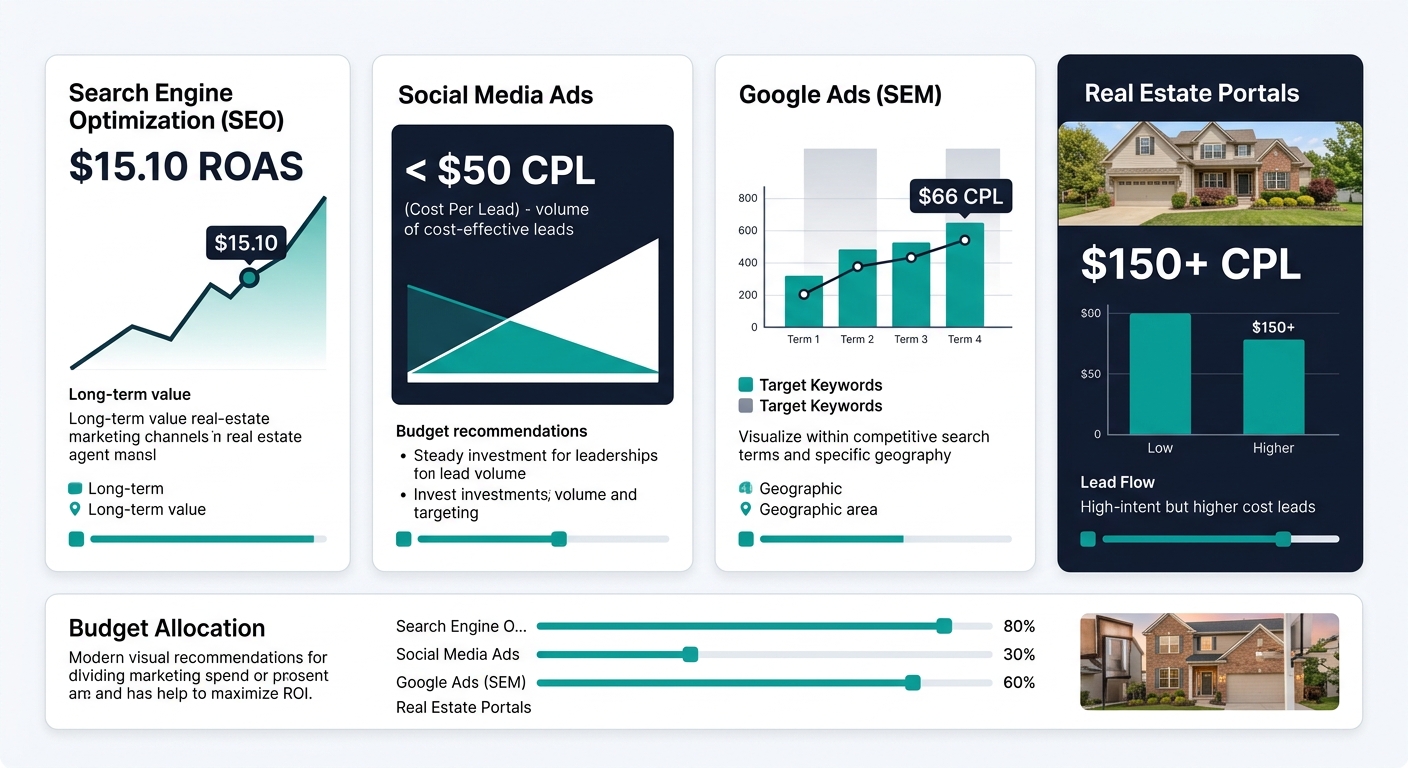
Cost per lead is the metric agents talk about most, but few measure it accurately. The $416–$480 average CPL disguises enormous variation by platform. Facebook generates leads as low as $5–$25 per contact. Google Ads averages around $66. Portal leads from platforms like Zillow can run $150 or more per contact.
The problem is that agents often blend these numbers together into a single “marketing spend divided by total leads” calculation that masks what’s working and what’s bleeding money. A real lead cost benchmarking exercise separates each channel and measures CPL independently.
And here’s where the math gets uncomfortable: paid advertising in real estate produces an average return on ad spend (ROAS) of about $1.40. SEO-driven content produces a ROAS of $15.10. That’s a 10x difference. Agents who allocate 80% of their budget to paid channels and 10% to organic content are structurally disadvantaged in any competitive performance audit.
SEO-driven content produces a ROAS of $15.10 compared to $1.40 for paid ads. Agents who spend 80% of their budget on paid channels are structurally disadvantaged in any performance audit.
This doesn’t mean paid ads are worthless. It means most agents over-rely on them and under-invest in the channels that compound over time. The agents who score highest on digital marketing KPIs in real estate tend to run a dual strategy: paid for immediate pipeline, organic for long-term cost reduction.
The Follow-Up Breakdown That Tanks Close Rates
A 22% lead-to-close rate is the benchmark for top-performing agents. The industry average falls well below that, and the reason usually has nothing to do with lead quality.
Speed to first contact is the single biggest predictor of whether a lead converts. Agents who respond within five minutes are dramatically more likely to reach a prospect than those who wait an hour. Yet most agents don’t have systems in place to guarantee fast response times, especially on evenings and weekends when buyer inquiries peak.
The second failure point is follow-up cadence. The typical agent makes one or two attempts to reach a new lead, then moves on. High-converting agents have a structured sequence that includes calls, texts, and emails spread across days and weeks. If you’ve experienced the pattern where your site captures leads but never converts them, broken follow-up is almost always the culprit.
CRM usage data tells a blunt story here. Agents who track pipeline velocity, appointment set rates, and lead stage progression close at meaningfully higher rates than agents who manage contacts in their phone or a spreadsheet. The CRM itself doesn’t close deals, but the discipline of tracking digital marketing KPIs in real estate forces accountability that improves outcomes.
Tip: Run a two-week audit on your own response times. Log the exact minute each new lead comes in and when you first make contact. If your average response time exceeds 30 minutes, that single metric is likely costing you more closed deals than any ad spend change.
What a Proper Performance Audit Measures
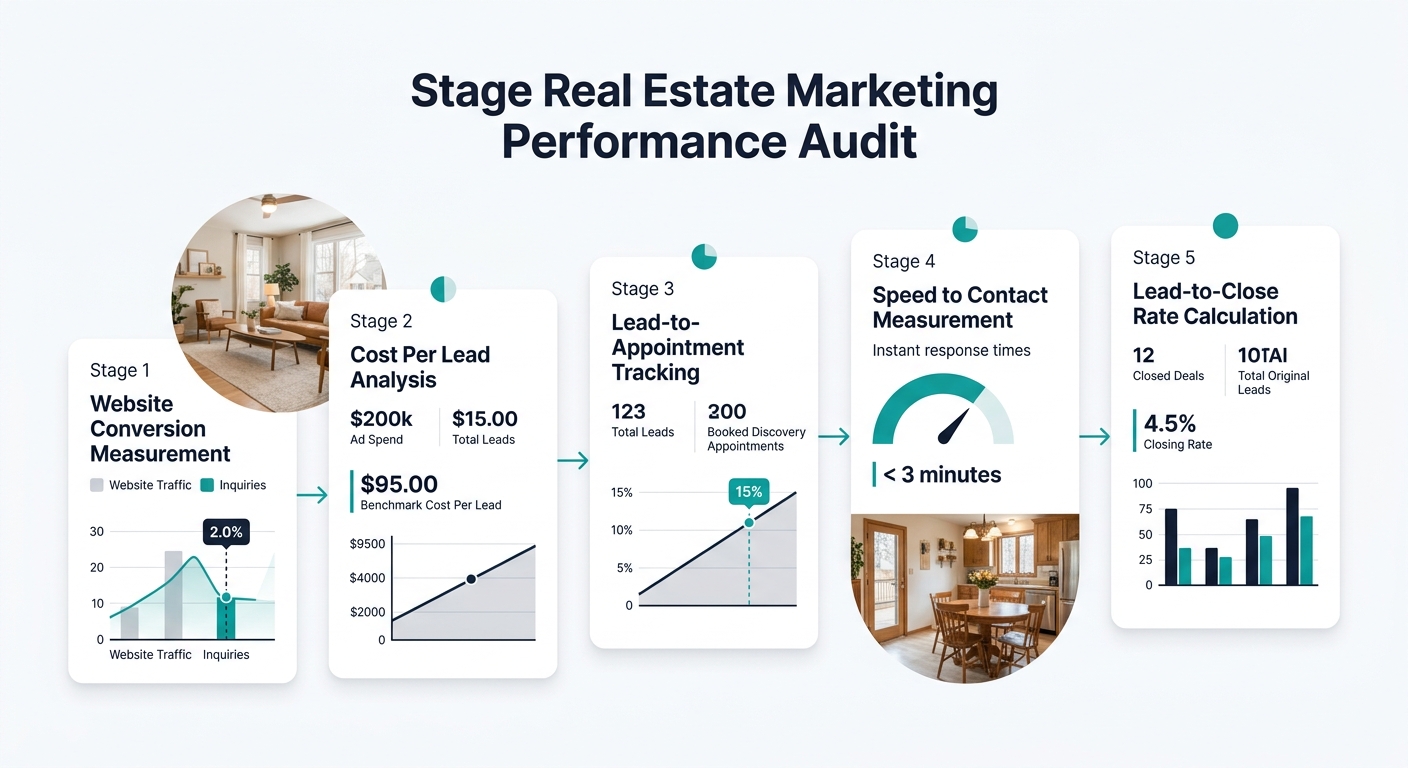
A real estate marketing benchmarks audit isn’t a vague exercise in “grading” your marketing. It’s a structured comparison of your numbers against verified industry data across five categories.
- Website conversion rate — your site’s visitor-to-lead percentage, broken down by traffic source and landing page
- Cost per lead by channel — separate CPL for paid search, social ads, organic search, portal referrals, and sphere-of-influence campaigns
- Lead-to-appointment rate — what percentage of captured leads result in a scheduled showing or consultation
- Speed to first contact — measured in minutes, not hours
- Lead-to-close rate — the full-funnel metric from first contact to closed transaction
Each of these has published benchmarks you can compare against. The exercise reveals which parts of your funnel perform at or above industry standards and which are dragging your overall score down. Agents who’ve never compared their website performance against competitors are often surprised to discover their weakest link isn’t traffic volume or ad spend. It’s conversion.
The audit also forces you to confront budget allocation. Research consistently shows that up to 73% of a typical agent’s marketing spend promotes the agent’s personal brand rather than individual listings. High-performing agents flip that ratio, directing at least 85% of marketing investment toward property promotion that generates measurable returns.
Fixing the Weakest Link First
The temptation after running a performance audit is to overhaul everything at once. Resist that. The data almost always points to one or two metrics that are significantly below benchmark, and those are where your effort should concentrate.
If your website conversion rate is below 2%, you have a page problem. Your forms are asking for too much information, your pages serve too many audiences, or your value proposition isn’t clear above the fold. Fix that before touching your ad budget.
If your CPL exceeds $400 but your conversion rate is healthy, you have a traffic quality problem. You’re spending money to reach people who aren’t serious buyers or sellers. Tightening your targeting, switching to street-level geo campaigns, or shifting budget from portals to organic content can cut that number substantially. Some agents have reduced CPL by 40% through targeting changes alone.
If your leads are cheap and plentiful but your close rate is low, you have a follow-up problem. No amount of marketing optimization will fix a pipeline where leads go cold because nobody called them back within a reasonable window.
And if your organic traffic is minimal, you have a content problem. Agents who build long-term SEO strategies rather than buying expensive leads consistently outperform on ROAS. That $15.10 organic ROAS doesn’t happen overnight, but it compounds in ways that paid advertising never will.
What These Benchmarks Still Can’t Answer
The numbers in this article come from aggregated industry data covering hundreds of teams and thousands of transactions. They’re useful for identifying where you fall relative to the field. They’re less useful for telling you exactly why.
A 2% website conversion rate could mean your site is poorly designed, or it could mean you serve a luxury market where qualified visitors are fewer but higher-value. A $500 CPL might be catastrophic for a first-year agent and perfectly acceptable for someone averaging $30,000 commissions per closing.
The benchmarks also can’t account for market-specific dynamics. An agent in a fast-moving suburban market faces different lead cost dynamics than one working rural acreage or urban condos. The 22% lead-to-close rate benchmark doesn’t adjust for whether your leads come from warm referrals or cold portal clicks, and those two sources convert at very different rates.
What a competitive performance audit gives you is a starting point, a set of specific numbers to track over time, and a framework for deciding where to put your next dollar. The agents who consistently score above industry benchmarks aren’t necessarily better marketers. They’re better at measuring what they do, identifying what underperforms, and fixing one thing at a time until the math works in their favor.