

Your real estate website’s true cost per lead is a function of total annual spend divided by the number of leads your site actually generates. That total includes subscription fees, IDX access, plugins, design work, and maintenance. The average cost per lead in real estate hit $503 in 2026, up 12.3% from the prior year according to a NAR survey of 5,400 professionals. Your monthly fee tells you almost nothing about whether your site earns its keep.
TL;DR: Monthly pricing is the smallest component of your real estate website’s actual lead cost. IDX fees, conversion losses from poor architecture, and the gap between traffic and captured leads inflate the real number by 2–5×. Run a full cost-per-lead calculation on a 36-month timeline before comparing builders or justifying a switch.
These seven rules form a real estate website investment analysis framework for agents and brokers who want honest answers about what their site costs them per closed deal.
Always calculate total annual spend before dividing by anything
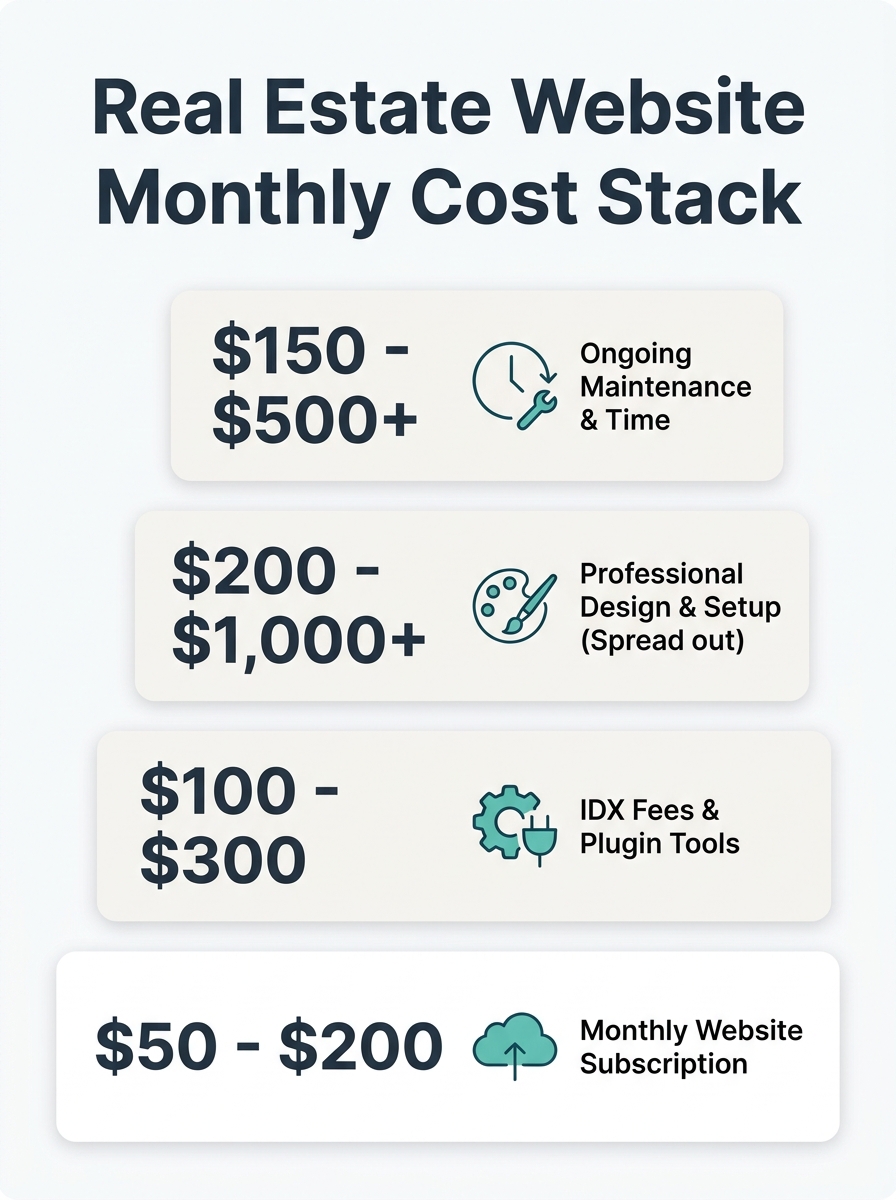
The monthly subscription on your builder’s pricing page represents roughly 30–45% of your actual annual website cost. The rest hides in line items you’re probably not tracking: IDX integration fees that run $600 to $1,500 per year for MLS data access and maintenance, premium plugin costs like Placester’s $25/month add-ons for AI-generated landing pages, domain renewal, SSL certificates, and any freelance design or copywriting work you commission throughout the year.
Build a single spreadsheet. Put every website-related expense into it: monthly subscription, annual IDX fees, one-time template purchases ($20 to $100+ depending on complexity), CRM integration charges, and your own time spent maintaining listings. A $59/month builder that requires $1,200/year in IDX fees, $300 in template customization, and 4 hours of your monthly time (valued at your effective hourly rate) doesn’t cost $708/year. It costs $2,200+ before you’ve attributed a single hour of content creation.
If you’ve already started this accounting, the hidden costs breakdown walks through line items agents commonly miss.
Separate website-sourced leads from every other channel
Your cost per lead by website builder is meaningless if you’re lumping Zillow leads, Instagram DMs, and open house sign-ins into the same bucket. The blended average cost per lead across all channels runs $416 to $480 in 2026, but that number, as Jamil Academy’s benchmarking report states, “is almost useless on its own.” Zillow leads alone cost $20 to $60 each depending on your market. That lower Zillow number drags the average down and masks the real performance (or failure) of your website.
Set up source tracking in your CRM. Tag every lead that arrives through your website’s contact forms, property inquiry buttons, or chat widgets separately from paid portal leads, social leads, and referral leads. If your builder doesn’t let you distinguish organic website leads from paid ad traffic landing on your site, you’re flying blind on the one metric that determines whether your website investment pays for itself.
The formula: Total Annual Website Cost ÷ Website-Sourced Leads = Your Website Cost Per Lead. An agent spending $2,400/year on their site who captures 30 organic leads has an $80 cost per lead. That same agent capturing only 8 leads has a $300 cost per lead, and might be better off spending that budget on Zillow. Painful realization, but necessary.
Include IDX and MLS data fees in your website cost column
IDX integration is the single largest variable cost in a real estate website budget, and agents routinely forget to count it. A custom real estate website with full IDX functionality costs more than $1,000 per month when you add design, development, hosting, and ongoing maintenance, according to Luxury Presence’s 2026 pricing analysis. Even on a template builder, MLS data access fees add $30 to $100 per month per region, plus the $600–$1,500 annual maintenance cost as MLS data fields change.
If your website doesn’t include IDX search, and many template sites don’t, you need to ask whether you’re losing leads to Zillow and Realtor.com because buyers can’t search listings on your site. And if it does include IDX, every associated fee belongs in your real estate website ROI calculator. The IDX line item alone can double your effective monthly cost.
Tip: Ask your MLS provider for a full fee schedule before signing up for any IDX integration. Some MLSs charge setup fees of $200–$500 on top of monthly data access fees, and switching MLSs later means paying those setup costs again.
For agents weighing different builder tradeoffs around speed, customization, and lead cost, IDX pricing is usually the factor that breaks the tie.
Compare builders on conversion rate, not monthly subscription
A $29/month builder that converts 0.5% of visitors into leads and a $149/month builder that converts 2.5% of visitors produce radically different cost-per-lead numbers, and the expensive one wins by a wide margin. Suppose both sites get 1,000 monthly visitors. The cheap builder captures 5 leads per month (60 per year) at a total annual subscription cost of $348, yielding roughly $5.80 per lead before any other costs. The expensive builder captures 25 leads per month (300 per year) at $1,788/year, yielding $5.96 per lead. Nearly identical on a per-lead basis, but the expensive builder generated 240 more leads.
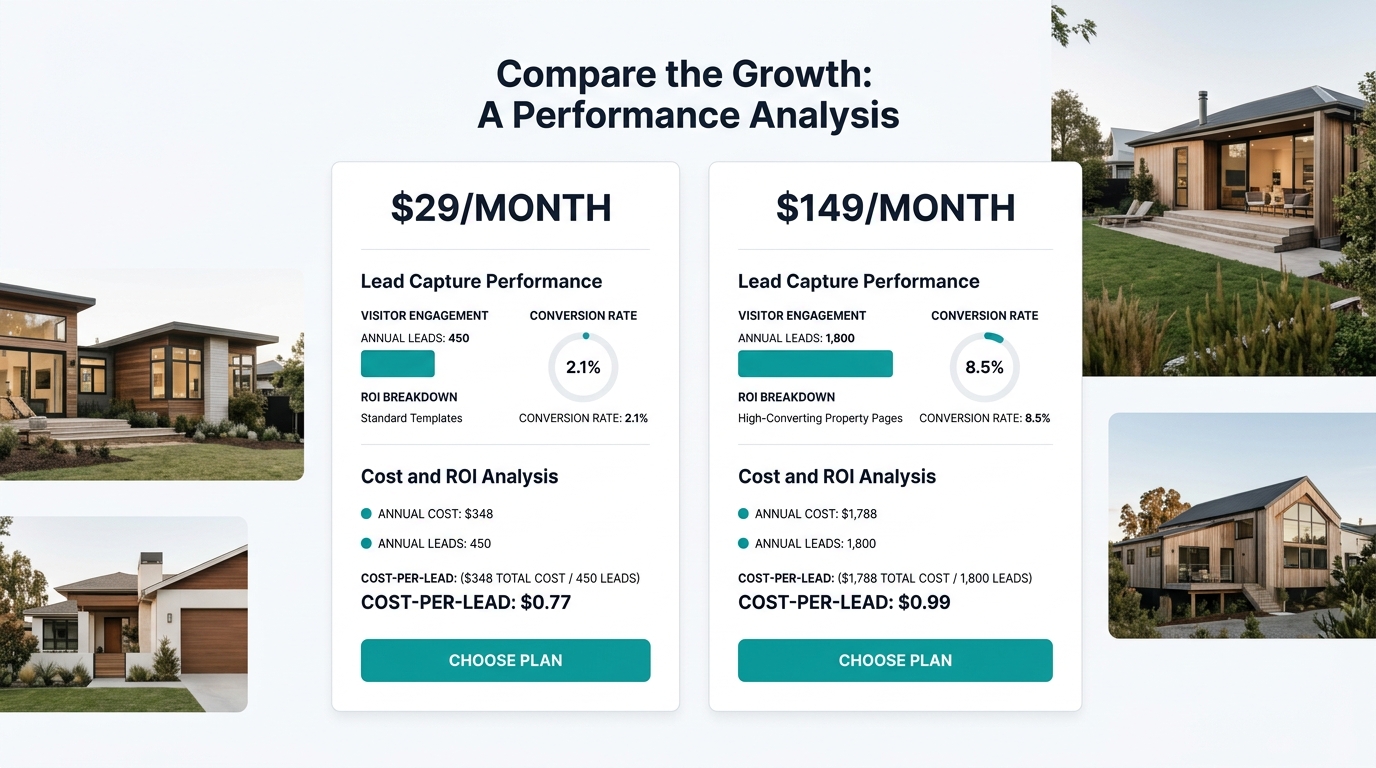
The real difference shows up when you add IDX fees, plugin costs, and design work. The cheap builder’s total might climb to $1,800/year while still producing only 60 leads ($30 each). The expensive builder’s total might hit $3,500/year but produce 300 leads ($11.67 each). Monthly price told you one story. Cost per acquisition told a completely different one.
When evaluating conversion rates, how your site structures CTA placement matters as much as the builder itself. A well-placed form on a mediocre template outperforms a buried form on a premium custom site every time.
Benchmark your cost per lead against $503 before celebrating
That NAR figure, $503 per lead averaged across 5,400 real estate professionals, includes agents spending heavily on paid advertising, portal subscriptions, and direct mail alongside their websites. Your website-only cost per lead should be significantly lower than $503 if your site is performing well. If it’s above $200 from organic traffic alone, something is structurally wrong with either your traffic acquisition or your conversion architecture.
If your website-only cost per lead exceeds $200 from organic traffic, the problem is structural, and no amount of ad spend fixes a leaky site.
Break the number down further. What’s your cost per lead from organic search visitors vs. paid traffic visitors vs. social media referrals that land on your site? Organic leads from SEO-driven traffic should carry the lowest per-lead cost because you’re not paying per click. If they don’t, your site architecture and page hierarchy are likely leaking visitors before they ever reach a capture point.
Track the leads your site architecture is losing for free
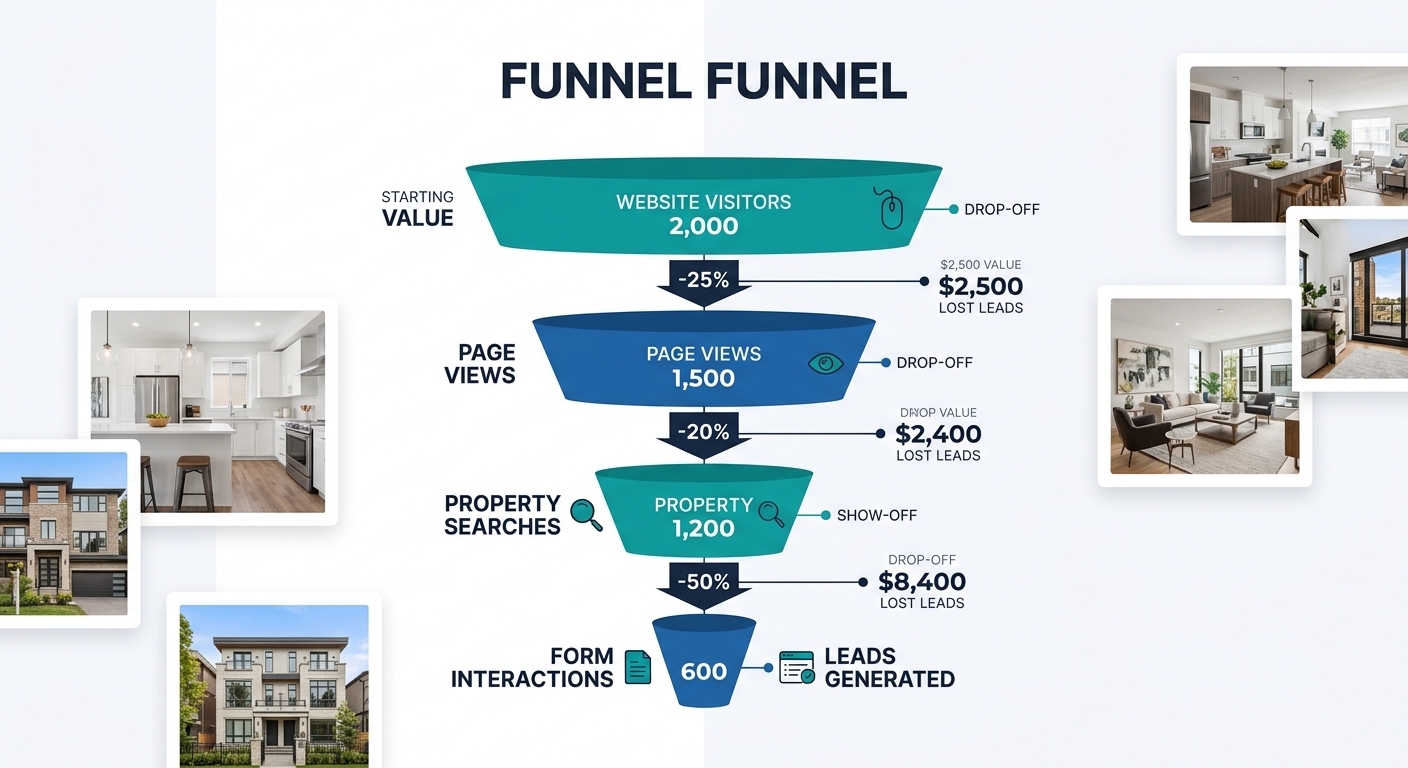
Every visitor who lands on your site, browses two pages, and leaves without submitting a form represents a lead you already paid for (through SEO effort, ad spend, or time) and didn’t capture. Google Analytics shows you the exit pages. Hotjar or Microsoft Clarity show you where visitors stop scrolling. The cost of these lost leads is invisible in your spreadsheet, but it inflates your true cost per acquisition dramatically.
A site getting 2,000 monthly visitors with a 1% conversion rate captures 20 leads. If improving form placement, page speed, and mobile navigation pushes that rate to 2.5%, you now capture 50 leads per month without spending an additional dollar. Your cost per lead drops by 60%. This is why fixing Core Web Vitals issues functions as a direct ROI play, not a technical vanity project.
Run the template-vs-custom math on a 36-month horizon
The template vs custom website cost per acquisition comparison flips depending on your time horizon. Over 12 months, a $50 template on a $29/month builder ($398 total before IDX) almost always looks cheaper than a custom site at $1,000+/month. Over 36 months, the template agent has spent approximately $5,400–$8,000 (including IDX, plugins, and design refreshes), while the custom site agent has spent $36,000–$48,000. But if the custom site generates 4× the leads per month, the per-lead math can favor it.
| Factor | Template Builder | Custom Build |
|---|---|---|
| 36-Month Total Cost | $5,400–$8,000 | $36,000–$48,000 |
| Typical Monthly Leads (1,000 visitors) | 5–15 | 20–40 |
| 36-Month Lead Volume | 180–540 | 720–1,440 |
| Cost Per Lead (36-Month) | $15–$44 | $25–$67 |
| Time to Launch | 1–5 days | 4–12 weeks |
The table tells an interesting story: template builders often win on cost per lead even over 36 months, because the absolute cost difference is so large. Agents who need to build a listing website quickly and iterate based on lead data often find that starting with a purpose-built template and reinvesting savings into better content and local SEO produces the highest total return.
The real question behind your real estate website pricing justification isn’t “which costs less per month?” It’s “which produces more closings per dollar spent over three years?” And that answer depends entirely on whether you’re tracking the numbers from rules one through six.
When These Rules Fail You
These calculations assume your website is your primary digital lead generation asset. If you’re an agent who gets 90% of business from referrals and sphere of influence, even a $29/month site generating two leads a year might produce acceptable ROI, because you’re spending almost nothing on it. The framework above is designed for agents who treat their site as a lead generation engine and want to know if it’s performing.
The rules also break down in markets so competitive that organic SEO traffic is negligible regardless of site quality. In Manhattan or Beverly Hills, paid advertising and portal placement dominate lead flow, and your website functions more as a credibility validator than a lead source. Measuring your site’s ROI by lead count alone misses the deals it helped you win by convincing a seller you’re a serious professional.
And one final exception worth naming: if you’re generating fewer than 500 monthly visitors, your sample size is too small for conversion rate comparisons to mean anything statistically. Get traffic first, then measure what converts. The ROI framework becomes powerful only when you have enough data to trust it.