

Promodo’s 2026 real estate marketing benchmarks draw a clear dividing line: typical agent websites rank between position 50 and 100 for their target keywords in Google, while top performers sit inside the top 10. That 40-to-90-position gap separates agents who generate consistent organic leads from agents who barely appear in search results. And the uncomfortable part? The agents stuck at position 72 usually have no idea that’s where they are.
This is the benchmarking blind spot. Agents routinely analyze comps for property valuations, study days-on-market trends, and pull MLS data for listing presentations. But when it comes to their own websites, they’re flying without instruments. They don’t know their bounce rate relative to competitors, their organic keyword rankings compared to the agent across town, or whether their site speed is in the top quartile or the bottom tenth.
The Data Gap Between Property Analysis and Website Analysis
Real estate professionals are trained to be analytical about property. You wouldn’t price a home without pulling comps. You wouldn’t advise a seller without looking at days on market. Yet most agents treat their website as a fixed expense rather than a measurable asset.
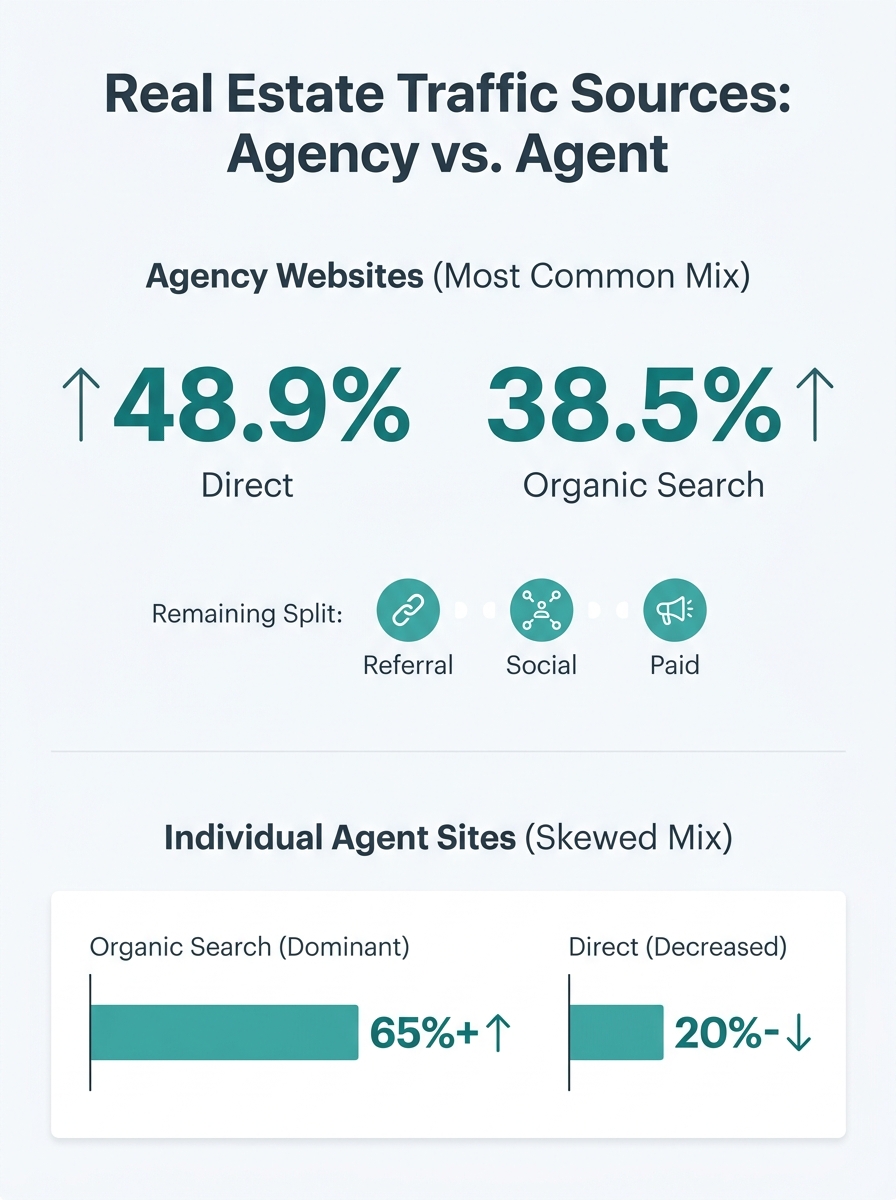
According to SimilarWeb’s industry benchmarks for the top 100 real estate websites globally, direct traffic accounts for 48.9% of visits and organic search drives 38.5%. Those two channels represent nearly 87% of all traffic reaching major real estate sites. For individual agent sites, the mix skews even more heavily toward organic search because agents don’t have the brand recognition that drives direct visits to Zillow or Realtor.com.
Here’s what that means for you: if you’re not tracking how your organic search performance stacks up against other agents in your market, you’re ignoring the channel that likely delivers the majority of your website visitors. And you’re doing it without even knowing the baseline.
Why Agents Skip Competitor Website Analysis
The reasons are practical, not mysterious. Running a competitor website analysis requires tools, time, and a framework that most agents were never taught. Real estate licensing courses cover contracts, ethics, and fair housing law. They don’t cover Core Web Vitals, keyword gap reports, or conversion rate benchmarking.
So agents default to the visual test. They pull up a competitor’s site, scan the design, check whether the photos look professional, and move on. This surface-level review misses everything that actually determines whether a site generates leads: page load speed, mobile usability, internal linking structure, form placement, and content depth on neighborhood and property pages.
As one competitive analysis guide puts it, you should be examining how detailed a competitor’s property descriptions are, what technology they use for their listings pages, and what information is missing. That level of inspection requires more than a quick scroll.
And there’s a psychological barrier too. Agents who’ve invested $3,000 to $10,000 in a website don’t necessarily want to discover that their competitor’s $2,000 site outranks them for every keyword that matters. The benchmarking blind spot is partly willful.
The Real Estate Digital Marketing Metrics That Actually Separate Winners
If you’re going to benchmark your site, you need to know which numbers matter. Not every metric deserves your attention, and vanity metrics like total page views or social followers can actively mislead you.
The lead generation KPIs that distinguish high-performing agent websites from the rest fall into a few categories:
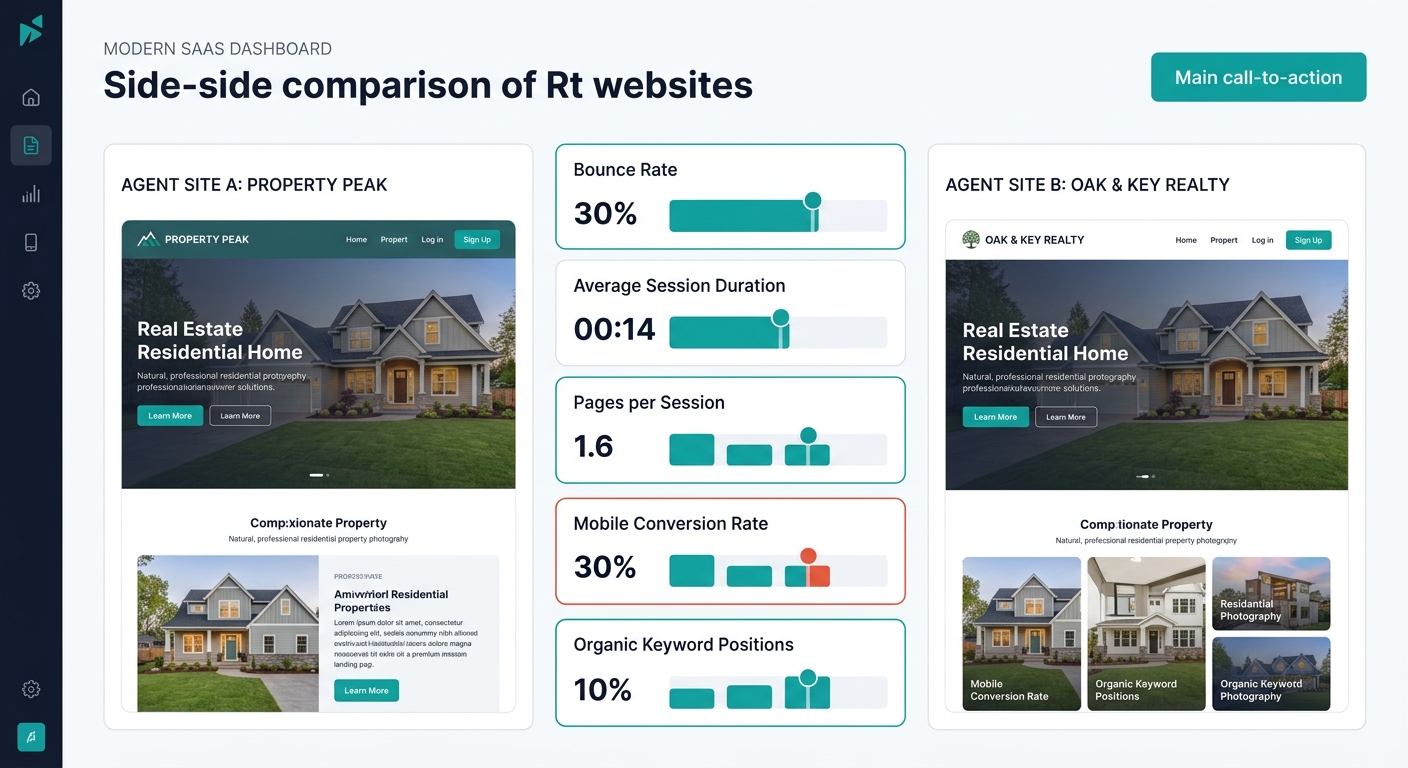
- Organic keyword positions: Where do you rank for “[your city] homes for sale,” “[neighborhood] real estate agent,” and similar buyer-intent terms? The difference between ranking in the top 10 versus ranking at position 50-plus is essentially the difference between visibility and invisibility.
- Conversion rate by device: The gap between desktop and mobile conversion on real estate sites is significant. If you haven’t audited why your mobile experience converts differently than desktop, you’re missing where leads disappear.
- Bounce rate relative to page type: A 70% bounce rate on a blog post about local market trends might be acceptable. A 70% bounce rate on a property detail page signals a serious problem with that page’s design, load time, or content quality.
- Lead-to-contact ratio: Tracking total leads captured is useful, but the ratio between leads captured and leads you actually reach by phone or email tells you whether your follow-up system works. Hommati’s breakdown of essential realtor KPIs highlights referral volume as a critical metric here because it reveals how much of your lead flow depends on channels outside your website entirely.
- Pages per session on listing content: This reveals whether visitors are browsing multiple properties or bouncing after one. Your property page structure and internal hierarchy directly affect how deep visitors go.
Tools That Enable Website Performance Benchmarks
The good news is that the tools exist. The bad news is that they require consistent use, not a one-time check.
For keyword and traffic comparison, SEMrush and Ahrefs let you enter a competitor’s domain and see their top organic keywords, estimated traffic, and backlink profile. Placester’s guide to competitive intelligence tools for real estate agents catalogs over a dozen options that reveal other agents’ top keywords, traffic sources, ad copy, and ranking changes over time.
For market share and listing performance, platforms like BrokerMetrics offer side-by-side comparisons of sales volume and days on market at the brokerage level. BatchData’s competitive benchmarking platform provides granular filters that analyze market share by property type, ZIP code, neighborhood, or price range, giving agents visibility into how their competitors are positioned at the hyperlocal level.
For site speed and technical performance, Google’s PageSpeed Insights and Lighthouse audits are free and immediate. Run your site, then run your top three competitors’ sites. Compare Largest Contentful Paint, Interaction to Next Paint, and Cumulative Layout Shift scores. If your competitor’s listing pages load a full second faster, that gap affects both search rankings and user experience.
Tip: Run a PageSpeed Insights test on your homepage, one listing page, and one neighborhood page. Then do the same for your top local competitor. The comparison often reveals that sites which feel similar to a human eye perform very differently where Google measures.
The pattern here is straightforward: pick three to five competitors, run the same tests on their sites that you’d run on yours, and record everything in a spreadsheet you update quarterly. Real estate website benchmarking doesn’t require enterprise software. It requires discipline.
The Content Gap Nobody Measures
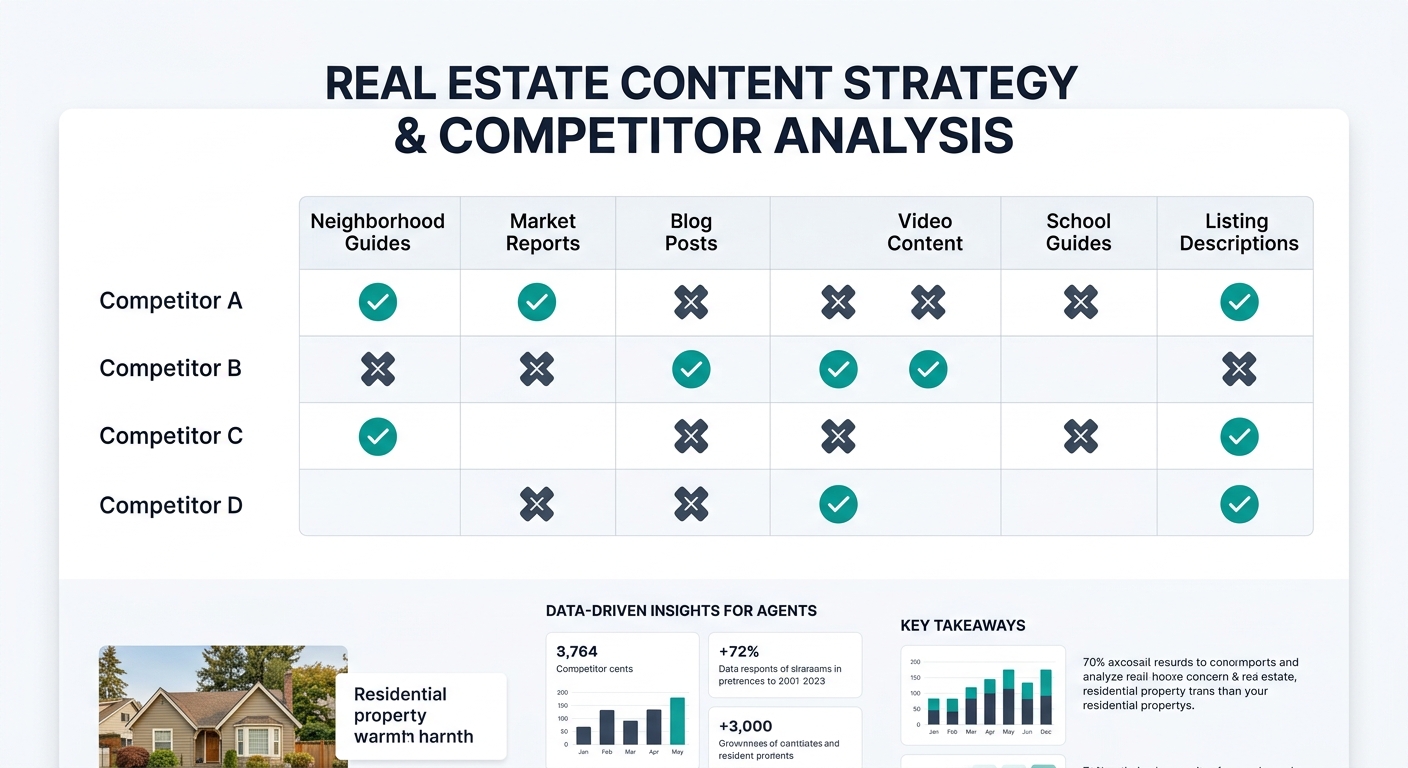
Beyond technical metrics, the content gap between your site and a competitor’s is one of the most valuable and most ignored benchmarking dimensions.
Pull up a competitor’s site and count their neighborhood pages. Count their blog posts from the past six months. Check whether they have community guides, school district breakdowns, or local market data pages. If they’ve built micro-content hubs around specific neighborhoods and you haven’t, their site is capturing long-tail search traffic you’ll never see.
Realtyna’s research on tracking competitors makes an important point: content that gets shared reveals a niche your competitors found that you haven’t explored yet. Spending time analyzing why that content resonates gives you a map of where to invest your own efforts.
The hidden architecture of your website also plays a role here. Two sites can have identical content volume but wildly different internal linking, URL structures, and schema markup. These invisible differences determine which site Google trusts more for a given search query.
Agents routinely analyze comps for property valuations and study days-on-market trends. But when it comes to their own websites, they’re flying without instruments.
What Benchmarking Reveals About Lead Generation KPIs
When agents finally do run a competitor website analysis, the results tend to cluster around a few uncomfortable revelations.
First, agents frequently discover their keyword strategy overlaps almost entirely with competitors, meaning everyone is fighting for the same 10 to 15 terms while ignoring hundreds of lower-competition phrases. The agents ranking in Google’s top 10 for relevant keywords have typically built content around 50 to 200 long-tail variations, targeting terms like “best elementary schools near [subdivision]” or “townhomes under 400k in [ZIP code]” rather than battling over “[city] real estate agent.”
Second, conversion infrastructure varies more than design quality. One agent might have a beautiful site that captures leads through a single contact form on the homepage. A competitor with a less polished design might have seven distinct lead capture points distributed across listing pages, neighborhood guides, and market report downloads. The second site will almost certainly generate more leads per visitor, because it offers more entry points matched to different stages of buyer intent.
Third, follow-up speed and automation differ enormously. Plecto’s 2026 analysis of essential real estate KPIs emphasizes tracking conversion rates and sales cycle length in real time, because the gap between lead capture and first contact is where deals die. Benchmarking your response time against your competitors’ is harder to do externally, but you can test it yourself by submitting an inquiry on their site and timing the response. You may be surprised at how many agents take 24 hours or longer to reply.
Questions The Numbers Still Can’t Answer
All of this data tells you where you stand relative to competitors on measurable dimensions. It tells you whether your site is faster, whether your content library is deeper, whether your keywords are more targeted.
What it doesn’t tell you is whether the leads you generate are any good. A site that converts at 4% but attracts tire-kickers produces worse business outcomes than a site converting at 1.5% with serious buyers. Benchmarking conversion rates without qualifying the leads behind those rates gives you a number that feels useful but may point you in the wrong direction.
The numbers also can’t capture relationship equity. An agent with a mediocre website but a 15-year reputation in a specific ZIP code will outperform a benchmarking-optimized newcomer for years, because referrals and repeat clients don’t arrive through Google. The emphasis on referral tracking as a key lead generation KPI across multiple industry analyses reflects this reality: some of the most valuable business never touches your website at all.
And benchmarking tools can’t tell you what your competitors are planning. A competitor whose site looks stagnant today may be three weeks from launching a redesigned platform with new IDX integration, AI-powered search filters, and a content strategy that targets every gap in your current approach. What real estate website benchmarking gives you is a snapshot, not a forecast. The snapshot is valuable because without it you’re guessing. But treating any single benchmarking report as a definitive answer about your competitive position mistakes a photograph for a movie. The discipline of quarterly measurement, comparing the same real estate digital marketing metrics across the same competitors over time, is where the real intelligence accumulates. That’s the practice most agents are missing, and it’s the one that compounds.